

TL;DR
- Message History provides a guided mapping that stores selected MQTT message fields in EMQX Tables and manages the connector, rule, and action as one workflow.
- Operations teams can preview stored records, monitor pipeline metrics, and use SQL to investigate historical device behavior.
Message History: From a Support Question to an Operations Feature
Customer Support kept hearing the same question: after an incident, how can an operations team tell whether an expected message went missing?
To investigate an incident, operations teams need answers to two questions:
- Did the expected telemetry reach the persistence pipeline?
- What data did the device report during the incident window?
An MQTT broker routes messages but does not automatically retain a historical record of everything it receives. While EMQX Cloud provides Event History for troubleshooting recent client activity, it is not designed to retain historical MQTT payload data.
Event History records are stored in node-local disk logs, have no guaranteed fixed retention period, and are subject to a 10,000-event query limit.
Message History fills this gap by capturing selected MQTT message data in EMQX Tables, giving operations teams persistent records and pipeline metrics for subsequent investigation.
What Message History Adds
Message History turns selected MQTT traffic into durable, queryable records in EMQX Tables without requiring operators to build and maintain the connector, rule, and action themselves.
To create a message history mapping, an operator:
- Select the MQTT topic filter.
- Choose or create an EMQX Tables table.
- Map payload fields and message metadata to table columns.
- Assign each column a role: tag, field, or timestamp.
- Enable the mapping and verify that data is being written.
Behind the mapping, EMQX Cloud creates or reuses an EMQX Tables connector and creates the corresponding managed rule and action:
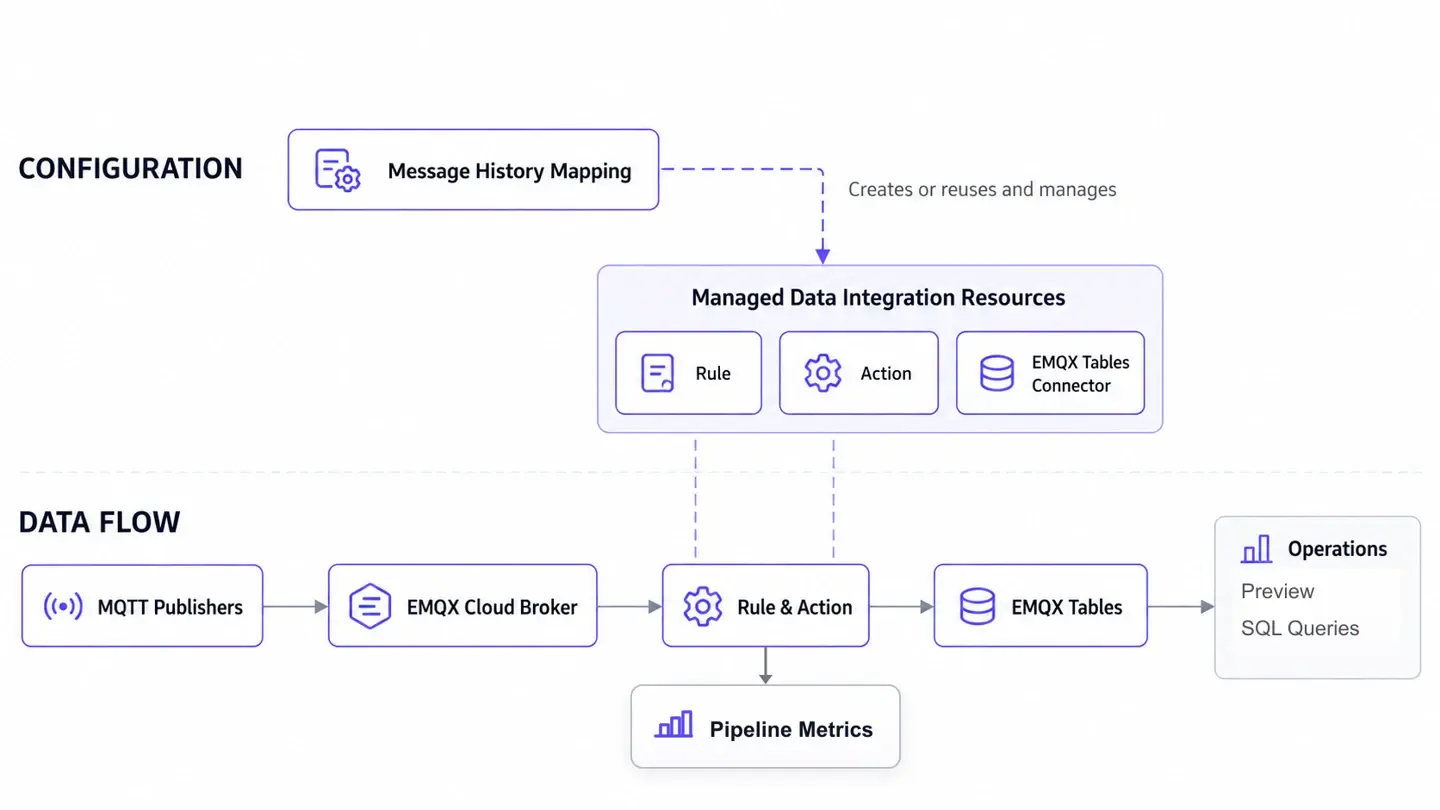
EMQX Tables provides the underlying persistent storage, while Message History manages the mapping and its associated data integration resources. For configuration steps, management options, and operational considerations, see the Message History documentation.
An Operations Example: Investigating Missing Telemetry
Consider a fleet of industrial devices publishing telemetry topics matched by the following filter:
factory/+/telemetry
A typical payload might look like this:
{
  "device_id": "press-17",
  "temperature": 74.6,
  "pressure": 118.2,
  "recorded_at": 1793152800000
}
An operator notices that a machine's telemetry is missing from a downstream monitoring application and needs to determine whether the device reported the data during the incident window.
To test this example, replace the value of recorded_at with the current Unix timestamp in milliseconds, and set Time Precision to millisecond (ms) when configuring the mapping. This ensures that the record falls within the time range used by the five-minute query later in this section.
For this investigation, map the payload as follows:
| Source value | Target column | Table role | Operational purpose |
|---|---|---|---|
device_id | device_id | Tag | Filter and group records by device |
temperature | temperature | Field | Analyze the reported measurement |
pressure | pressure | Field | Analyze the reported measurement |
recorded_at | timestamp | Timestamp | Preserve when the device produced the reading |
Tags work well for identifiers that operators frequently use for filtering and grouping. Fields represent changing measurements. Every mapping must contain at least one field.
Choose the timestamp based on the question you need to answer:
- Broker Received Time: When EMQX Cloud received the MQTT message.
- A timestamp from the payload: When the device produced the measurement.
For devices that buffer messages while offline and publish them after reconnecting, these timestamps answer different questions. Broker Received Time shows when the data entered EMQX Cloud; the device timestamp preserves when the measurement was originally taken.
Use Broker Received Time to investigate ingestion. Use the device timestamp to reconstruct when the measurement occurred. For schema and timestamp recommendations, see Design and Query Message History Data.
Once messages are stored, an operator can inspect the latest records:
SELECT *
FROM public."sensor_history"
ORDER BY "timestamp" DESC
LIMIT 10;
Or check whether a specific device produced data during the last five minutes:
SELECT *
FROM public."sensor_history"
WHERE "device_id" = 'press-17'
  AND "timestamp" >= now() - '5 minutes'::INTERVAL
ORDER BY "timestamp" DESC;
What a Stored Record Does and Does Not Prove
A stored row confirms the persistence path, not end-to-end MQTT delivery.
Specifically, it confirms that:
- The message reached the EMQX Cloud Broker.
- Its topic matched the enabled mapping.
- The selected fields were processed successfully.
- The persistence action wrote the record to EMQX Tables.
It does not prove that every intended MQTT subscriber received the message. Subscriber delivery is a separate stage of the MQTT message path.
A missing row is less conclusive. Before assuming that the broker dropped the message, check:
- Whether the mapping was enabled when the message was published.
- Whether the topic matched the configured topic filter.
- Whether the message contained the expected fields and timestamp format.
- Whether the mapping reported successful, failed, or dropped executions.
- Whether credentials, network connectivity, schema compatibility, or Data Integration limits affected the write.
For deeper message-lifecycle investigations, operations teams can combine Message History with logs, traces, and Data Integration rules that capture EMQX event topics. EMQX Cloud provides event topics for observing message publication and drop events when more detailed evidence is required. For an example, see Capture Message Publish and Drop Event Topic Messages via Data Integration.
Choose the Right Tool for Each Investigation
| Capability | Best suited for | Storage and scope |
|---|---|---|
| Event History | Recent connection, authentication, subscription, and disconnection troubleshooting | Short-lived diagnostic records stored locally by EMQX |
| Message History | Persistent analysis of selected MQTT message data | Selected payload and metadata fields stored in EMQX Tables |
| Data Integration | Custom event processing, transformations, multiple destinations, and advanced message-lifecycle capture | Operator-defined rules, actions, and external destinations |
Before You Enable Message History
Before enabling a mapping in production, decide what to store, how long to retain it, and how to monitor writes.
Limit the Topic Scope
A broad topic filter can store more data than intended and consume additional Data Integration TPS. Store only the topics and fields that your team expects to query.
Design the Schema for Investigation
Use stable identifiers as tags and changing measurements as fields. Avoid treating every payload attribute as a separate column without considering how operators will query it.
If a device firmware update changes a field’s data type, writes to an existing table may fail because of a schema mismatch. For incompatible schema changes, a new table and mapping may be safer than changing the meaning of an existing column.
Set an Appropriate Retention Policy
Disabling or deleting a Message History mapping stops new writes but does not delete records already stored in EMQX Tables. Existing records remain until they are explicitly removed or expire according to the table’s TTL configuration.
Retention should balance troubleshooting requirements, compliance obligations, query performance, and storage cost.
Monitor the Persistence Pipeline
The mapping exposes success, failure, and dropped execution metrics. These metrics describe the path from the matching rule to EMQX Tables; they are not end-to-end MQTT delivery metrics.
After creating or modifying a mapping:
- Publish a representative test message.
- Check the mapping metrics.
- Preview the resulting record.
- Query the target table.
- Confirm that identifiers, measurements, and timestamps have the intended meaning.
Remember That History Starts When the Mapping Starts
Message History only stores matching messages received while the mapping is enabled. It does not backfill messages published earlier, and it does not replay stored data to MQTT subscribers.
Availability and Prerequisites
At the time of writing, Message History is available on EMQX Dedicated and Dedicated Flex deployments running EMQX version 6.1.4 or later.
The Broker and EMQX Tables deployments must be reachable within the same network. An EMQX Tables deployment reached from another network through a NAT Gateway or PrivateLink is not eligible for this workflow. The database user also needs the required query and insert permissions.
For high-volume mappings, include Data Integration TPS and connector limits in capacity planning.
Because product availability and limits can change, consult the maintained Message History documentation before deployment.
A Queryable Record of MQTT Traffic
Message History makes historical MQTT data available for operational investigation without requiring teams to build a custom persistence pipeline. By combining queryable message records with Event History and Data Integration monitoring, EMQX Cloud gives operations teams better visibility into what devices reported, when messages entered the persistence pipeline, and where data processing issues occurred.