From MQTT Data to Real-Time Dashboards: IoT Visualization with EMQX Tables and Grafana


Introduction
In many IoT projects, building a real-time device dashboard often means deploying multiple infrastructure components, including an MQTT Broker, message queue, stream processing platform, time-series database, and dashboard system.
Although this architecture can be highly scalable, it also introduces:
- More components to operate and maintain;
- Longer data paths;
- Higher data synchronization complexity;
- Greater operations and troubleshooting costs.
For many device telemetry scenarios, what enterprises really need is not an increasingly complex data platform, but a lightweight way to move MQTT data into a Dashboard quickly.
By combining EMQX Tables and Grafana, you can directly implement:

Without deploying Kafka, ETL pipelines, or an external time-series database, organizations can quickly build real-time IoT dashboards with minimal infrastructure.
The value of EMQX Tables goes beyond data storage. It enables MQTT data to flow seamlessly from ingestion to SQL queries and visualization, simplifying the entire IoT data path.
Use Case: Smart Factory Equipment Monitoring
This article uses a smart factory equipment monitoring scenario to demonstrate how to build a real-time visualization platform with EMQX Tables and Grafana.
Devices in a factory periodically report the following telemetry data:
| Field | Description |
|---|---|
machine_id | Device ID |
production_line | Production line ID |
temperature | Temperature |
vibration | Vibration value |
machine_status | Operating status |
publish_at | Client-side sending timestamp |
Example MQTT Payload:
{
  "publish_at": 1773579492999,
  "production_line": "A1",
  "machine_id": "M100",
  "temperature": 56.2,
  "vibration": 0.83,
  "machine_status": "running"
}
The system must support:
- Real-time MQTT data ingestion
- Real-time time-series data storage
- SQL query capability
- Dashboard visualization
- Real-time anomaly alerts
Prerequisites
Before you begin, make sure the following preparations are complete:
- An EMQX Dedicated deployment has been created
- An EMQX Tables instance has been created
- EMQX Dedicated and EMQX Tables are in the same VPC network
- A username and password for MQTT connection have been created
- A server is available for running test scripts and Grafana
- Python 3 has been installed
paho-mqtthas been installed
You will need the following connection information:
| Parameter | Description |
|---|---|
| MQTT Host | EMQX Dedicated access address |
| MQTT Port | MQTT port, usually 1883 |
| Username | MQTT username |
| Password | MQTT password |
| Tables Host | EMQX Tables PostgreSQL Endpoint |
| Database | Tables database name, for example public |
| Tables User | Tables username |
| Tables Password | Tables password |
Create the EMQX Tables Data Table
Use the default database provided by EMQX Tables (for example, public) and create the following time-series table on the Tables Query page.
CREATE TABLE machine_metrics (
  "timestamp" TIMESTAMP TIME INDEX,
  "production_line" STRING,
  "machine_id" STRING,
  "temperature" DOUBLE,
  "vibration" DOUBLE,
  "machine_status" STRING
)
WITH (
  'append_mode'='true',
  'ttl'='7d'
);
This table stores factory equipment telemetry data.
Field descriptions:
| Field | Type | Description |
|---|---|---|
timestamp | TIMESTAMP | The time when EMQX receives the MQTT message, used as the time-series index |
production_line | STRING | Production line ID |
machine_id | STRING | Device ID |
temperature | DOUBLE | Temperature |
vibration | DOUBLE | Vibration value |
machine_status | STRING | Device operating status |
Table parameter notes:
append_mode='true': Telemetry data is continuously appended time-series data and is suitable for Append Mode.ttl='7d': Keeps only the most recent 7 days of data. You can adjust this based on production requirements.
If you need to optimize queries by production line or device, you can add Skipping Indexes to frequently filtered fields:
CREATE TABLE machine_metrics (
  "timestamp" TIMESTAMP TIME INDEX,
  "production_line" STRING SKIPPING INDEX,
  "machine_id" STRING SKIPPING INDEX,
  "temperature" DOUBLE,
  "vibration" DOUBLE,
  "machine_status" STRING
)
WITH (
  'append_mode'='true',
  'ttl'='7d'
);
Configure EMQX Data Integration
EMQX Rule Engine can write MQTT Payloads directly into EMQX Tables.
This article uses the following path:

Create a Tables Connector
Create a Tables Connector in the EMQX Cloud console:
Data Integration
→ Connectors
→ New Connector
→ EMQX Tables
When configuring the Connector, select the Tables instance that has already been created and confirm that:
- Database Name is the same as the Tables database, such as
public - Broker and Tables are in the same VPC network
- The Connector status is
Connectedafter creation
To ensure that the Broker and Tables communicate over the internal network, it is recommended to choose the same network as the Broker when creating Tables.
Configure Rule SQL
Create a Rule to listen to factory device reporting topics:
SELECT
  timestamp,
  payload.machine_id as machine_id,
  payload.production_line as production_line,
  payload.temperature as temperature,
  payload.vibration as vibration,
  payload.machine_status as machine_status
FROM "factory/+/metrics"
This rule listens to:
factory/+/metrics
and extracts telemetry fields from the MQTT Payload.
Configure the Action
Create an EMQX Tables Action for this Rule and use the following write template:
machine_metrics production_line=${production_line},machine_id=${machine_id},temperature=${temperature},vibration=${vibration},machine_status=${machine_status} ${timestamp}
Configuration notes:
machine_metricsis the target table name.- The content after the space is the list of fields to write.
temperatureandvibrationare DOUBLE values and do not require integer suffixes.${timestamp}is placed at the end and written into the time index column.
After this is complete, the data write path is ready.
Simulate MQTT Message Streams with the Python SDK
To better approximate a real IoT scenario, this article uses the Python SDK to simulate continuous device data reporting.
This validates:
- Continuous MQTT message writes
- Message throughput trends
- Telemetry data changes
- Grafana real-time Dashboard refresh
Install the Python MQTT SDK:
python3 -m pip install paho-mqtt
Publisher Script
Create the publisher script:
nano publisher.py
Code:
#!/usr/bin/env python3

import argparse
import json
import random
import time
from paho.mqtt import client as mqtt_client

parser = argparse.ArgumentParser()
parser.add_argument("--host", required=True)
parser.add_argument("--port", type=int, default=1883)
parser.add_argument("--username")
parser.add_argument("--password")
parser.add_argument("--topic", default="factory/A/metrics")
parser.add_argument("--qos", type=int, default=1)
parser.add_argument("--tps", type=float, default=1)
parser.add_argument("--duration-sec", type=float, default=60)
args = parser.parse_args()

def on_connect(client, userdata, flags, reason_code, properties):
    if reason_code != 0:
        raise RuntimeError(f"connect failed: {reason_code}")
    print(f"Connected to {args.host}:{args.port}")

client = mqtt_client.Client(
    mqtt_client.CallbackAPIVersion.VERSION2,
    client_id=f"python-mqtt-pub-{random.randint(0, 100000)}",
)
client.on_connect = on_connect

if args.username and args.password:
    client.username_pw_set(args.username, args.password)

client.connect(args.host, args.port)
client.loop_start()

machines = ["M100", "M101", "M102", "M103"]
lines = ["A1", "A2"]

interval = 1.0 / args.tps
start = time.perf_counter()
deadline = start + args.duration_sec
count = 0

while time.perf_counter() < deadline:
    machine_id = random.choice(machines)
    production_line = random.choice(lines)
    temperature = round(random.uniform(45.0, 95.0), 2)
    vibration = round(random.uniform(0.2, 1.6), 2)
    machine_status = "warning" if temperature > 80 or vibration > 1.2 else "running"

    payload = json.dumps(
        {
            "publish_at": int(time.time() * 1000),
            "production_line": production_line,
            "machine_id": machine_id,
            "temperature": temperature,
            "vibration": vibration,
            "machine_status": machine_status,
        },
        separators=(",", ":"),
    )

    result = client.publish(args.topic, payload, qos=args.qos)
    if result.rc != 0:
        raise RuntimeError(f"publish failed: {result.rc}")

    print(f"Sent: {payload}")
    count += 1
    time.sleep(interval)

print(json.dumps({"sent": count, "target_tps": args.tps}))
client.disconnect()
client.loop_stop()
Run example:
python3 publisher.py \
  --host xxxx.dedicated.aws.mqttce.net \
  --port 1883 \
  --topic factory/A/metrics \
  --qos 1 \
  --tps 1 \
  --duration-sec 60 \
  --username xxx \
  --password xxx
Subscriber Script
Create the subscriber script:
nano subscriber.py
Code:
#!/usr/bin/env python3

import argparse
import random
import time
from paho.mqtt import client as mqtt_client

parser = argparse.ArgumentParser()
parser.add_argument("--host", required=True)
parser.add_argument("--port", type=int, default=1883)
parser.add_argument("--username")
parser.add_argument("--password")
parser.add_argument("--topic", default="factory/A/metrics")
parser.add_argument("--qos", type=int, default=1)
parser.add_argument("--duration-sec", type=float, default=70)
args = parser.parse_args()

counter = {"received": 0}

def on_connect(client, userdata, flags, reason_code, properties):
    if reason_code != 0:
        raise RuntimeError(f"connect failed: {reason_code}")
    print(f"Connected to {args.host}:{args.port}")
    client.subscribe(args.topic, qos=args.qos)

def on_message(client, userdata, msg):
    counter["received"] += 1
    print(f"[{counter['received']}] {msg.topic} {msg.payload.decode()}")

client = mqtt_client.Client(
    mqtt_client.CallbackAPIVersion.VERSION2,
    client_id=f"python-mqtt-sub-{random.randint(0, 100000)}",
)
client.on_connect = on_connect
client.on_message = on_message

if args.username and args.password:
    client.username_pw_set(args.username, args.password)

client.connect(args.host, args.port)
client.loop_start()

start = time.perf_counter()
while time.perf_counter() - start < args.duration_sec:
    time.sleep(1)

elapsed = time.perf_counter() - start
print({"received": counter["received"], "duration_sec": round(elapsed, 3)})

client.disconnect()
client.loop_stop()
Run example:
python3 subscriber.py \
  --host xxxx.dedicated.aws.mqttce.net \
  --port 1883 \
  --topic factory/A/metrics \
  --qos 1 \
  --duration-sec 70 \
  --username xxx \
  --password xxx
Recommended run order:
- Start the Subscriber first.
- Start the Publisher.
- Wait for the Publisher to finish sending messages.
- Query EMQX Tables.
- Check whether the Grafana Dashboard refreshes in real time.
After the test is complete, run the following query in EMQX Tables:
SELECT
  "timestamp",
  production_line,
  machine_id,
  temperature,
  vibration,
  machine_status
FROM machine_metrics
ORDER BY "timestamp" DESC
LIMIT 20;
Connect Grafana to EMQX Tables
EMQX Tables is fully compatible with the PostgreSQL protocol, allowing Grafana to query MQTT telemetry directly through the PostgreSQL data source.
No additional Adapter, ETL, or data synchronization service is required.
Install Grafana
The following example is based on Ubuntu:
sudo apt update
sudo apt-get install -y adduser libfontconfig1 musl
wget https://dl.grafana.com/oss/release/grafana_11.0.0_amd64.deb
sudo dpkg -i grafana_11.0.0_amd64.deb
Start the Grafana service:
sudo systemctl daemon-reload
sudo systemctl enable grafana-server
sudo systemctl start grafana-server
sudo systemctl status grafana-server
Open the following URL in a browser:
http://<EC2-Public-IP>:3000
If you use a cloud server, make sure the security group allows access to port 3000.
Default credentials for first login:
Username: admin
Password: admin
Add a PostgreSQL Data Source
In Grafana, navigate to:
Connections
→ Add new data source
→ PostgreSQL
Enter the PostgreSQL connection information provided by EMQX Tables:
| Parameter | Example |
|---|---|
| Host | xxx.aka.aws.tables.mqttce.net:4003 |
| Database | public |
| User | test |
| Password | ****** |
| SSL Mode | require |
After configuration, click Save & Test.
If the connection succeeds, Grafana displays:
Database Connection OK
Build Real-Time Device Dashboards
This article builds multiple real-time IoT Dashboards based on EMQX Tables and Grafana to monitor device operating status, MQTT message traffic, industrial telemetry data, and abnormal behavior.
1. Active Device Count KPI Panel
This Dashboard shows the number of active devices that have reported data in the last 5 minutes.
Example SQL:
SELECT
  count(DISTINCT machine_id) AS active_devices
FROM machine_metrics
WHERE "timestamp" >= now() - INTERVAL '5 minutes';
Grafana can display the result as a large number in a Stat Panel.
2. MQTT Message Throughput Trend Analysis
This Dashboard analyzes MQTT message traffic, data reporting frequency, and message throughput trends.
Example SQL:
SELECT
  date_trunc('minute', "timestamp") AS time,
  count(*) AS messages
FROM machine_metrics
GROUP BY time
ORDER BY time;
Grafana can display MQTT Messages/min in real time.
3. Real-Time Industrial Telemetry Monitoring
This Dashboard shows real-time industrial device telemetry, including temperature trends, vibration trends, and device operating status.
Example SQL:
SELECT
  "timestamp" AS time,
  machine_id,
  temperature,
  vibration
FROM machine_metrics
ORDER BY time DESC
LIMIT 100;
Grafana can use Time Series, Gauge, or Heatmap panels to implement real-time industrial equipment monitoring.
The average temperature Gauge panel can use:
SELECT
  avg(temperature) AS avg_temperature
FROM machine_metrics
WHERE "timestamp" >= now() - INTERVAL '5 minutes';
4. Anomaly Alert Trend Analysis
This article uses the following anomaly conditions:
- Temperature > 80°C
- Vibration > 1.2
Example SQL:
SELECT
  "timestamp" AS time,
  machine_id,
  temperature,
  vibration
FROM machine_metrics
WHERE temperature > 80
   OR vibration > 1.2
ORDER BY time DESC;
Grafana can further use Alerting to send Email, Slack, or Webhook alerts.
5. Device Status Distribution Monitoring
This Dashboard shows the distribution of device operating status, including the number of Running devices and Warning devices.
Example SQL:
SELECT
  date_trunc('hour', "timestamp") AS time,
  count(DISTINCT machine_id) AS active_devices
FROM machine_metrics
GROUP BY time
ORDER BY time;
Grafana can visualize device status with a Pie Chart or Bar Chart.
6. Active Device Trend Analysis
This Dashboard analyzes device reporting trends, active device count, and connection stability.
Example SQL:
SELECT
  date_trunc('hour', "timestamp") AS time,
  count(DISTINCT machine_id) AS active_devices
FROM machine_metrics
GROUP BY time
ORDER BY time;
This is suitable for Device Fleet Monitoring, Edge Connectivity Analysis, and IoT Capacity Planning.
Validation Results
Validation confirmed that the complete visualization pipeline worked as expected:

The following checks all passed successfully:
- MQTT QoS 1 publish and subscribe
- Rule matched
factory/+/metrics - Tables Action completed without
failed,dropped, orinflight - Tables queried the written
machine_metricsdata
Validation criteria:
Rule matched > 0
Rule actions.success = matched
Action success = matched
Action failed = 0
Action dropped = 0
Action inflight = 0
Tables can query the latest telemetry data
Why EMQX Tables Is Better Suited for IoT Dashboard
Shorter Data Path
Traditional architecture:

EMQX Tables:

This approach significantly reduces middleware, Connectors, and data synchronization links, resulting in a lighter overall architecture.
Lower Operational Complexity
No Kafka cluster, Flink, Debezium, external TSDB, or ETL pipeline is required, reducing deployment and maintenance effort.
Native MQTT Integration
EMQX Rule Engine can directly process MQTT Payloads without protocol conversion, independent Consumers, or additional Stream Processing.
Better for Real-Time Visualization
A simplified architecture enables:
- Lower latency
- Faster dashboard refresh
- Fewer synchronization failures
- Easier troubleshooting
Well suited for Smart Factory, Industrial IoT, Device Monitoring, and Edge Telemetry.
Native Access to the Grafana Ecosystem
EMQX Tables is compatible with the PostgreSQL protocol, so it can directly connect to mainstream visualization platforms such as Grafana without additional Adapters or data synchronization components.
Summary
In this article, you built a complete real-time IoT visualization pipeline using EMQX Tables and Grafana, from MQTT data ingestion and time-series storage to SQL queries and dashboard visualization.
By combining EMQX Rule Engine, EMQX Tables, and Grafana in a single workflow, this architecture simplifies the path from device telemetry to real-time insights with minimal infrastructure.
For MQTT-native telemetry scenarios, EMQX Tables provides a simpler and more efficient foundation for real-time visualization.
Appendix: Validated Dashboard Example
After EMQX Rule Engine writes data into EMQX Tables, Grafana can directly connect to the PostgreSQL-compatible interface of EMQX Tables for visualization.
Validation environment:
- Grafana: 12.3.1
- Datasource: PostgreSQL
- EMQX Tables Host:
pca393c7.aka.aws.tables.mqttce.net - Port: 4003
- Database:
public - SSL Mode:
require - Dashboard: EMQX Tables Factory IoT Operations
Note: In Grafana 12.x, the PostgreSQL datasource must explicitly configure the default database. In addition to setting Database to public, jsonData must also include database: public; otherwise, panels may show No data and the browser console may report default database not configured.
Final Dashboard Effect
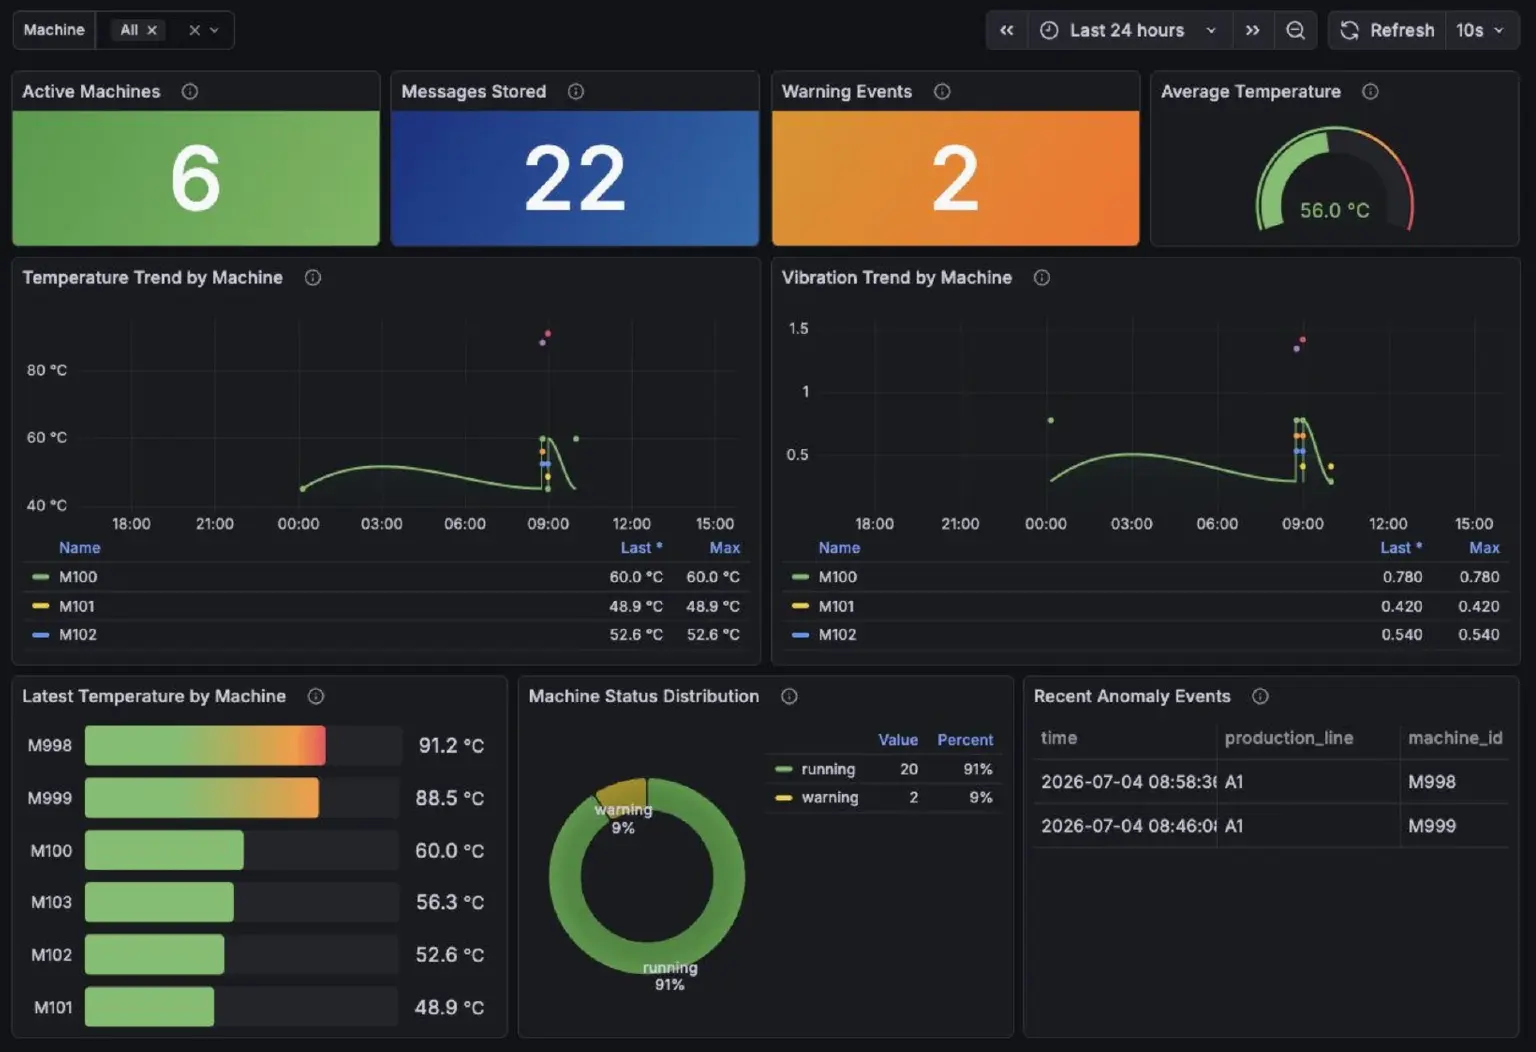
After importing the Dashboard JSON, Grafana successfully queried real data from EMQX Tables. The core results are:
- Active Machines: 6
- Messages Stored: 22
- Warning Events: 2
- Average Temperature: 56.0 °C
- Machine Status Distribution: running 91%, warning 9%
- Recent Anomaly Events: M998, M999
Final Grafana Dashboard: