Beyond MQTT Broker Monitoring: Enabling Unified Data Observability with EMQX Tables

Introduction
Traditional MQTT architectures separate data access from data observability. While the MQTT Broker handles device connectivity and message delivery, operational data such as telemetry, connection events, message traces, and audit records is often distributed across independent monitoring, storage, and analytics systems.
This separation creates data silos and operational challenges. Teams lack a unified view of MQTT activity, making it difficult to trace message flows, investigate device issues, perform historical analysis, or provide sufficient context for AI-driven operations.
To address these challenges, IoT platforms need an MQTT-native data observability layer that can capture, store, and analyze operational data throughout the MQTT lifecycle.
EMQX Tables enables this capability by extending MQTT data beyond the Broker runtime. Combined with EMQX Dedicated, Rule Engine, Event Topics, Grafana, and AI analytics services, it provides a unified data foundation for telemetry analysis, message tracing, auditing, visualization, and intelligent operations.
This article demonstrates how to build an MQTT data observability platform with EMQX Tables, including device monitoring, message tracing, audit analysis, dashboard visualization, and AI-powered operational insights.
Architecture Design
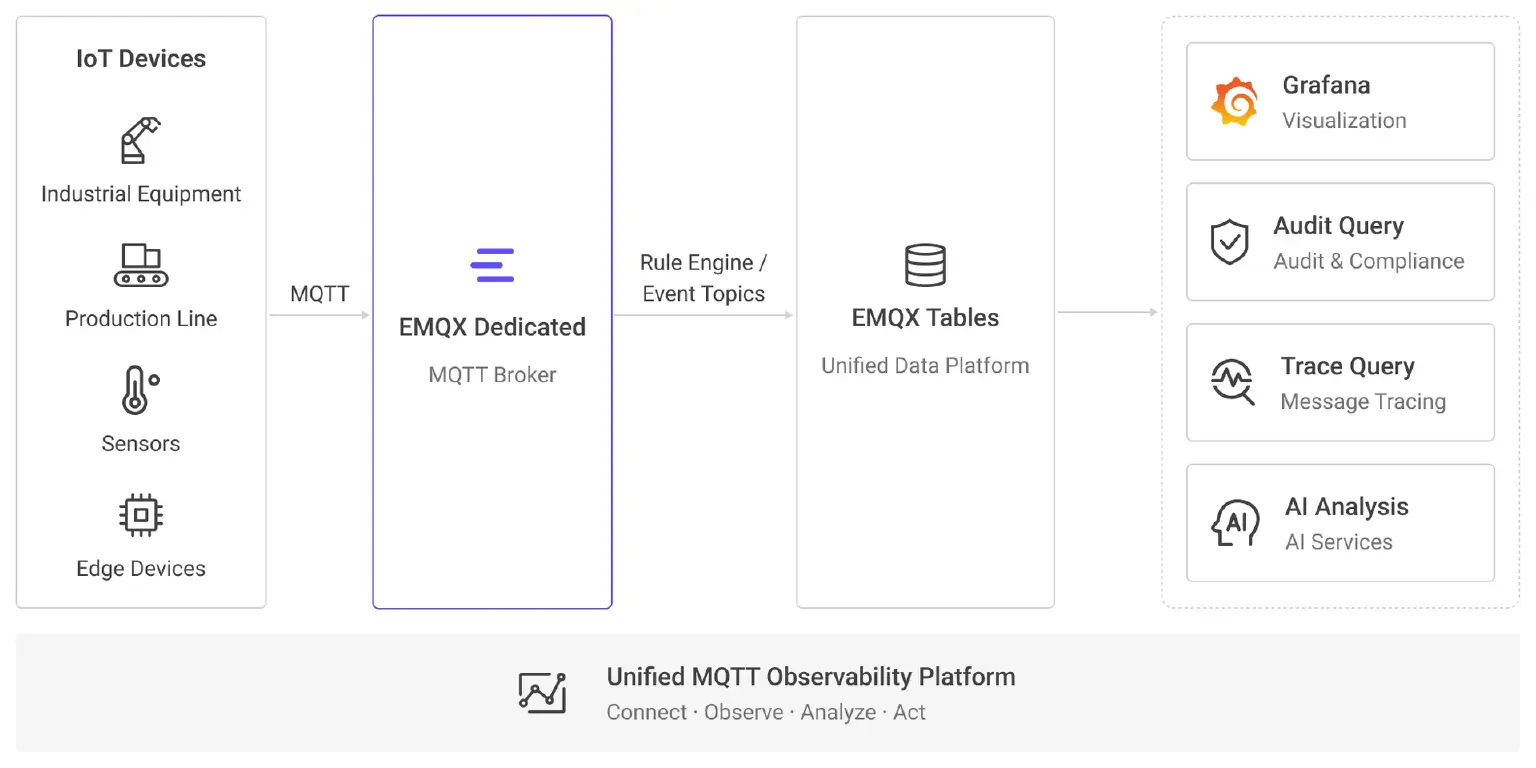
In this architecture:
- EMQX Dedicated handles MQTT access and message transmission.
- Rule Engine extracts observable data from MQTT messages and Event Topics.
- EMQX Tables stores device telemetry, message traces, and audit logs in a unified way.
- Grafana provides real-time visualization.
- AI analysis services can read both historical data and current Broker runtime metrics to generate operations recommendations.
Use Case: Smart Factory Equipment Monitoring
This article uses smart factory equipment monitoring as an example. Devices continuously report the following MQTT Payload:
{
  "production_line": "A1",
  "machine_id": "M100",
  "temperature": 82.5,
  "vibration": 1.25,
  "machine_status": "warning"
}
Goals:
- Monitor device status
- Analyze message traffic
- Audit historical activity
- Track message lifecycle
- Automatically generate operations recommendations
Unified Data Model Design
To support complete observability analysis, the following data can be stored in EMQX Tables in a unified way:
| Data Type | Table Name | Description |
|---|---|---|
| Device Metrics | machine_metrics | Device telemetry data, such as temperature, vibration, and status |
| Message Traces | mqtt_message_traces or mqtt_message_traces_stable | Link events such as message publish, delivery, and ACK |
| Audit Logs | mqtt_audit_logs | Message audit records that support queries by Topic, Client, and message stage |
In the current validation environment, all three types of tables already exist:
SHOW TABLES;
Verified tables:
machine_metrics
mqtt_message_traces
mqtt_message_traces_stable
mqtt_audit_logs
Note: In this environment, the table that contains real message trace data is mqtt_message_traces_stable, whose fields are timestamp and event. If a customer environment uses the table name mqtt_message_traces, choose event_at and event_name or timestamp and event according to the actual table schema.
Device Observability
Device observability is implemented through the machine_metrics table.
Observable metrics include:
- Temperature
- Vibration
- Device Status
- Production Line
Example query:
SELECT
  machine_id,
  AVG(temperature) AS avg_temperature,
  AVG(vibration) AS avg_vibration
FROM machine_metrics
GROUP BY machine_id
ORDER BY machine_id;
Validation result:
machine_id  avg_temperature  avg_vibration
M100        52.63            0.54
M101        48.93            0.42
M102        52.63            0.54
M103        56.33            0.66
M998        91.2             1.42
M999        88.5             1.35
Query device status distribution:
SELECT
  machine_status,
  count(*) AS total,
  avg(temperature) AS avg_temperature,
  avg(vibration) AS avg_vibration
FROM machine_metrics
GROUP BY machine_status
ORDER BY machine_status;
Validation result:
machine_status  total  avg_temperature  avg_vibration
running         20     52.63            0.54
warning         2      89.85            1.385
This shows that EMQX Tables can directly query device health status and identify devices with high temperature and high vibration.
Message Observability
Message observability answers questions such as:
- Did the message enter the Broker?
- Was the message delivered to the subscriber?
- Did a QoS 1 or QoS 2 message receive an ACK?
- Which lifecycle stages did a specific message pass through?
A message path usually includes:
Publisher
  ↓
message.publish
  ↓
message.delivered
  ↓
message.acked
If the message trace table mqtt_message_traces_stable is used, run:
SELECT
  "timestamp",
  event,
  msg_id,
  trace_key,
  topic,
  pub_clientid,
  sub_clientid,
  qos
FROM mqtt_message_traces_stable
ORDER BY "timestamp" DESC
LIMIT 20;
In the validation result, mqtt_message_traces_stable contains:
event              count
message.publish    32
message.delivered  25
message.acked      22
Example result:
timestamp                 event              topic      pub_clientid              sub_clientid              qos
2026-07-04 07:22:49.694   message.acked      emqx/test  mqtt-audit-1783149768665  mqtt-audit-1783149768665  1
2026-07-04 07:22:49.571   message.delivered  emqx/test  mqtt-audit-1783149768665  mqtt-audit-1783149768665  1
2026-07-04 07:22:49.562   message.publish    emqx/test  mqtt-audit-1783149768665                            1
If the trace table in the customer environment uses the event_at and event_name fields, change the query to:
SELECT
  event_at,
  event_name,
  msg_id,
  trace_key,
  topic,
  pub_clientid,
  sub_clientid,
  qos
FROM mqtt_message_traces
WHERE event_name IN ('message.delivered', 'message.acked')
ORDER BY event_at DESC
LIMIT 20;
Note: Field names must match the actual table schema. Do not use timestamp and event with an event_at and event_name schema, and do not use event_at and event_name with a timestamp and event schema.
Audit Observability
Audit observability is implemented through mqtt_audit_logs, supporting:
- Topic queries
- Client queries
- Historical message audit
- Fault investigation
- Message stage confirmation
Query by Topic:
SELECT
  "timestamp",
  topic,
  qos,
  pub_clientid
FROM mqtt_audit_logs
WHERE topic='emqx/test'
ORDER BY "timestamp" DESC
LIMIT 20;
Validation result:
timestamp                 topic      qos  pub_clientid
2026-07-04 07:22:49.694   emqx/test  1    mqtt-audit-1783149768665
2026-07-04 07:22:49.692   emqx/test  1    mqtt-audit-1783149768665
2026-07-04 07:22:49.690   emqx/test  1    mqtt-audit-1783149768665
Count by message stage:
SELECT
  audit_stage,
  count(*) AS cnt
FROM mqtt_audit_logs
WHERE topic='emqx/test'
GROUP BY audit_stage
ORDER BY audit_stage;
Validation result:
audit_stage  cnt
acked        16
delivered    15
publish      15
Query link stages by Message ID:
SELECT
  msg_id,
  topic,
  count(*) AS stages
FROM mqtt_audit_logs
WHERE topic='emqx/test'
GROUP BY msg_id, topic
ORDER BY stages DESC
LIMIT 10;
In the validation result, multiple messages have all three stages: publish, delivered, and acked. This means the messages entered the Broker, were delivered, and completed ACK.
Visualization Observability
Grafana can connect directly to EMQX Tables through the PostgreSQL data source.
It is suitable for displaying:
- Active Devices
- Temperature Trends
- MQTT Throughput
- Warning Devices
- Device Distribution
- Recent Anomaly Events
The Grafana Dashboard has been imported and validated. Core metrics are:
Active Machines: 6
Messages Stored: 22
Warning Events: 2
Average Temperature: 56.0 °C
Machine Status Distribution: running 91%, warning 9%
Recent Anomaly Events: M998, M999
Final Dashboard effect:
Grafana 12.x notes:
- The PostgreSQL datasource must explicitly configure Database.
- In addition to
database=public, it is recommended to setjsonData.database=public. - If the datasource does not configure a default database, panels may show
No data, and the browser console may reportdefault database not configured.
AI-Driven Observability
Traditional dashboards can only display data. AI analysis services can further answer:
- Which devices have the highest risk?
- Which metrics are worsening?
- Which devices need maintenance?
- What is the current overall risk level?
- Are there any anomalies in Broker connections, subscriptions, or message rates?
Analysis flow:

The EMQX Management API has been validated to return current Broker runtime metrics:
{
  "connections": 0,
  "live_connections": 0,
  "received_msg_rate": 0,
  "sent_msg_rate": 0,
  "rules_matched_rate": 0,
  "actions_executed_rate": 0,
  "dropped_msg_rate": 0
}
The AI analysis service can combine the following context:
- Device temperature, vibration, and status in
machine_metrics - Message audit stages in
mqtt_audit_logs - Message lifecycle events in
mqtt_message_traces_stable - Real-time Broker metrics from EMQX
/monitor_current
This upgrades the system from simple dashboard visualization to automated diagnosis, for example:
There are currently 2 warning devices:

- M998: temperature=91.2, vibration=1.42
- M999: temperature=88.5, vibration=1.35

Recommendations:

1. Prioritize checking the production line where M998 is located.
2. Check whether high temperature and high vibration continue to increase.
3. Use mqtt_audit_logs to query whether Topics related to this device have message delivery failures.
4. If Broker dropped_msg_rate increases, further check subscriber consumption capacity.
Why Build a Unified MQTT Observability Platform
Single Data Platform
Unified storage for telemetry, audit, and trace. No need to maintain a separate database for each type of data.
Shorter Data Path
Traditional architecture:

EMQX Tables architecture:

Lower Operations Cost
There is no need to maintain Kafka, Flink, Elasticsearch, an Independent Audit Platform or Trace Storage.
Native MQTT Integration
EMQX Rule Engine can directly process MQTT Payloads and Event Topics without additional Consumers or protocol conversion.
AI-Oriented Data Foundation
Historical data in EMQX Tables can directly serve as context for AI Agents or analysis services, upgrading operations from manual dashboard troubleshooting to automated diagnosis.
Notes
- Message trace table fields must be consistent with the query SQL.
- If the table fields are
timestampandevent, usetimestampandeventin queries. - If the table fields are
event_atandevent_name, useevent_atandevent_namein queries.
- Payload should not be stored long term by default.
For business messages that contain sensitive data, apply masking, truncation, or avoid storing the Payload. - TTL must be controlled in high-TPS scenarios.
Message events can generate a large number of writes, so configure TTL according to the message rate. - The Grafana datasource must correctly configure the default database.
For the Grafana PostgreSQL datasource, it is recommended to explicitly configuredatabase=publicandjsonData.database=public.
Summary
EMQX Tables is more than a time-series storage capability. Combined with Rule Engine, Event Topics, Grafana, and AI analysis services, it can become the core data layer of an MQTT data observability platform.
By storing device telemetry, message paths, audit logs, and historical runtime data in a unified way, enterprises can build a complete Observability Architecture that covers connections, messages, devices, business data, and AI analysis.
Compared with traditional architectures that rely on Kafka, ETL, external TSDBs, log platforms, and independent tracing systems, EMQX Tables provides a lighter, more native, and easier-to-implement path.
For IoT platforms that want to reduce architectural complexity, improve troubleshooting efficiency, and further build AI-driven operations capabilities, EMQX Tables can become the key foundation for moving from an MQTT Broker to a unified observable data platform.