
Introduction
Maintaining high availability and responsiveness in large-scale MQTT deployments requires robust, continuous observability. With proper monitoring in place, platform engineering and operations teams can detect abnormal traffic trends before they lead to downtime, rapidly perform root cause analysis during incidents, diagnose message latency bottlenecks, and debug individual client connections or data bridges.
EMQX 6.3.0 has expanded its data integration ecosystem by introducing native OTLP integration support for Dynatrace. By utilizing OpenTelemetry standards and secure OAuth2 token authentication, EMQX now makes it easier than ever to export system logs and distributed traces directly to Dynatrace.
This post provides a step-by-step guide on how to configure EMQX 6.3 to forward telemetry data to Dynatrace and highlights key operational signals to look out for to maintain a healthy cluster.
Overview of Dynatrace
Dynatrace is an AI-powered observability platform that provides automated ingestion of system logs, metrics, and event traces. It allows operators to monitor complex cloud environments, analyze transactional performance, and build customized real-time visualization dashboards to maintain system health and performance SLAs.
Why Integrate EMQX with Dynatrace?
By combining Dynatrace's Distributed Tracing capabilities with EMQX's OpenTelemetry log and trace export, operators gain granular visibility into MQTT message flows.
Specifically, this integration allows you to:
- Focus on Specific Entities: Filter distributed traces by specific
clientids, topics, IP addresses, or data integration rules. - Simplify Debugging: Narrow down latency and issues across the different stages of an MQTT message's lifetime that might be affecting just one or a few devices.
- Reduce Log Noise: Resolve localized connection or payload issues directly without becoming overwhelmed by high volumes of low-level system logs.
Step-by-Step Configuration Guide
Configuring EMQX to export telemetry data to Dynatrace can be completed directly from the EMQX Dashboard.
Step 1: Gather Credentials from Dynatrace
Before starting, retrieve the following values from your Dynatrace account:
- Dynatrace OTLP Endpoint: For SaaS environments, the endpoint format is:
https://{your-environment-id}.live.dynatrace.com/api/v2/otlp - OAuth2 Authentication Credentials:
- Client ID & Client Secret
- Token Endpoint
- Target Resource
(Note: EMQX uses OAuth2 authentication for increased security, as it provides short-lived, scoped tokens that are easily rotated or revoked as needed.)
Step 2: Enable Dynatrace Integration in EMQX
- Log in to the EMQX Dashboard.
- Navigate to Management → Monitoring → Integration → OpenTelemetry.
- Select Dynatrace.
- Input the OTLP endpoint and OAuth2 credentials collected in Step 1.
- Enable your desired telemetry signals (Logs and Traces).
Once enabled, EMQX will begin forwarding these events to Dynatrace, where you can visualize them and set up custom dashboards.
What Signals to Monitor in Dynatrace
After establishing telemetry ingestion, you can configure custom Dynatrace dashboards and alert channels around key operational signals.
Dynatrace offers built-in Distributed Tracing visualizations. Combined with EMQX tracing capabilities, operators can follow an affected client's message flow for a fixed amount of time to debug bottlenecks across different steps an MQTT message goes through its lifetime.
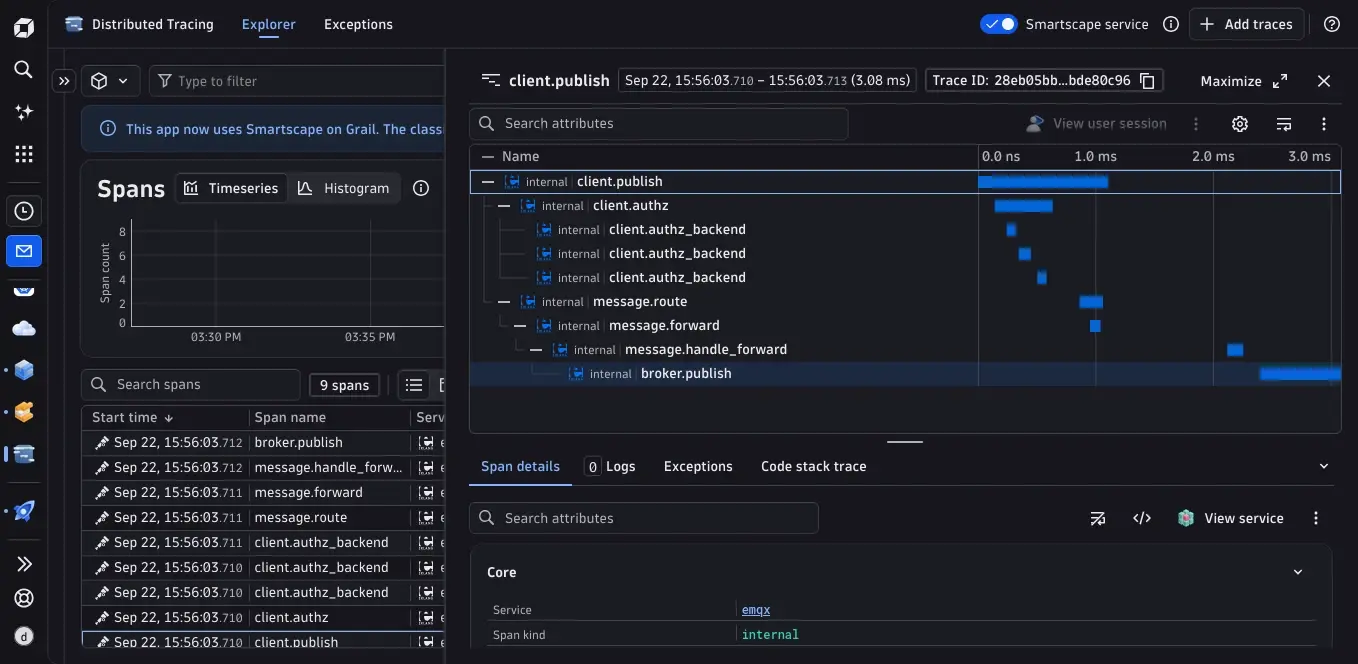
Exploring distributed tracing allied with EMQX trace-by-clientid capabilities
To better visualize cluster health via log events, add the following log events (indicated in monospaced font) to your dashboards:
- Erlang VM & Inter-Node Health:
busy_dist_port,long_schedule,long_gc
These pertain to the Erlang VM and inter-node communication health. Alert on a sustained rate or repeated events and correlate them with Mria queues, CPU, and latency. These events can precede client-visible degradation. - Cluster Configuration Sync:
sync_data_from_node_failed,cluster_rpc_apply_failed
These indicate configuration synchronization failure among cluster nodes. Alert immediately when a configuration change or node startup is in progress; verify that all nodes have converged on the intended configuration. - Data Bridge Throughput:
data_bridge_buffer_overflow,unrecoverable_resource_error,dropped_msg_due_to_mqueue_is_full
When utilizing Data Integrations, these logs indicate a remote integration is not keeping up with incoming data throughput. Alert when these events are unexpected or exceed the application's accepted loss rate, and correlate them with action and message-drop counters. - Client Session Processing:
session_buffer_high_watermark
Indicates that a client’s session is not processing its delivered messages fast enough. Investigate every warning. If the threshold represents an actionable per-session risk, configure an alert. Raise the alert priority when warnings occur for multiple clients or correlate with increased memory use orbusy_dist_port. Captureclientid,mqueue_length,inflight_count,total_payload_bytes, andtotal_payload_bytes_high_watermark, and useemqx ctl session-topto identify the sessions retaining the most payload bytes. Once clientids are collected, collect a Distributed Trace as mentioned above.
Next Steps & Resources
For more in-depth information and recommendations on how to increase the observability of your cluster, be sure to check out our documentation on both setting up Dynatrace and best monitoring practices.