Building an IoT Intelligent Analytics Assistant with EMQX Tables and the OpenAI Agents SDK

Why IoT Data Needs Intelligent Analysis
IoT platforms generate massive amounts of telemetry data every day, including temperature, vibration, current, device status, and operational metrics.
While this data can be stored, visualized, and queried through traditional IoT platforms, extracting meaningful insights from it remains challenging as device fleets grow.
Operations teams often need answers to questions such as:
- Which devices are showing potential failure risks?
- Is an abnormal value temporary, or does it indicate a worsening trend?
- Which devices should be prioritized for maintenance?
Traditional dashboards can display metrics and trends, but they usually cannot explain why an issue occurs or automatically provide diagnostic conclusions and recommended actions.
With the advancement of large language models and AI Agent technologies, IoT platforms are evolving from data visualization toward intelligent operations. Enterprises need more than monitoring; they need systems that can understand data, generate insights, and support decision-making.
Building an IoT Analytics Assistant with EMQX Tables
AI Agents require reliable access to both historical telemetry data and real-time device context to generate meaningful operational insights.
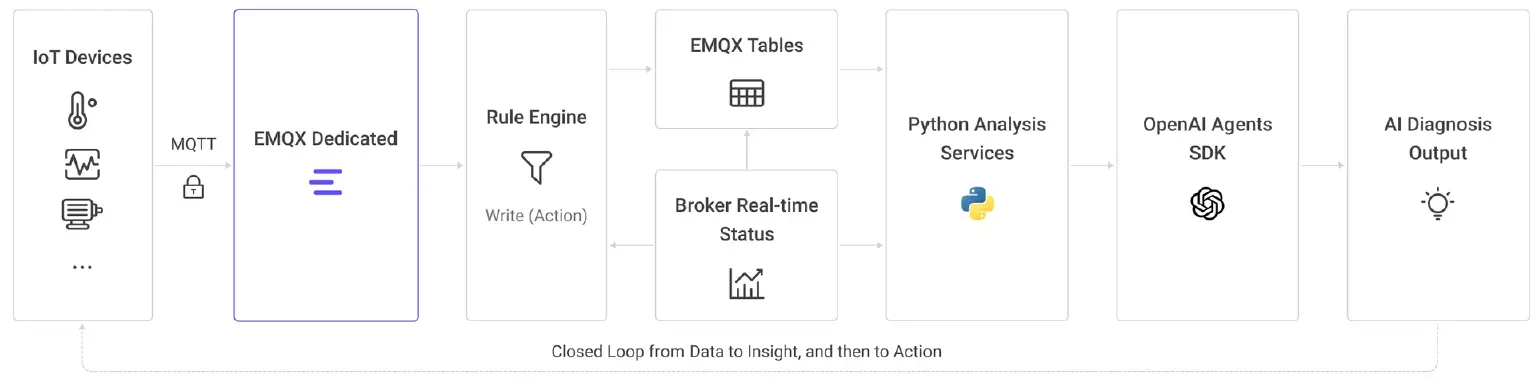
EMQX Tables provides a structured and queryable data foundation by continuously storing MQTT telemetry data in a time-series format. Combined with EMQX Dedicated, Rule Engine, real-time Broker status, and the OpenAI Agents SDK, it enables the development of an intelligent analytics assistant for IoT operations.
Architecture Design
The assistant can support:
- Device health assessment
- Anomaly detection and trend analysis
- High-risk device identification
- Root cause analysis
- Automated operations recommendations
By organizing MQTT telemetry into structured data, EMQX Tables enables AI Agents to move beyond data retrieval and generate actionable insights for IoT operations.
The entire process does not require building a complex data platform or an independent AI data pipeline. Based on MQTT historical data and real-time Broker status, you can quickly build intelligent IoT analytics capability.
Use Case
Factory equipment continuously reports the following telemetry data:
machine_id: Device IDproduction_line: Production linetemperature: Temperaturevibration: Vibrationmachine_status: Device status
Example MQTT Payload:
{
  "production_line": "A1",
  "machine_id": "M100",
  "temperature": 89.2,
  "vibration": 1.42,
  "machine_status": "warning"
}
Prerequisites
Make sure:
- EMQX Dedicated has been created.
- EMQX Tables has been created.
- MQTT clients can connect normally.
- A Python 3 environment is ready.
- An OpenAI-compatible API Key is ready, such as an Alibaba Cloud Model Studio DashScope API Key.
Install dependencies:
python3 -m venv venv
source venv/bin/activate
pip install openai openai-agents psycopg2-binary requests
Create the Telemetry Table
Create the machine_metrics table in EMQX Tables:
CREATE TABLE machine_metrics (
  "timestamp" TIMESTAMP TIME INDEX,
  "production_line" STRING,
  "machine_id" STRING,
  "temperature" DOUBLE,
  "vibration" DOUBLE,
  "machine_status" STRING
)
WITH (
  'append_mode'='true',
  'ttl'='7d'
);
Note: This article uses timestamp as the time column and no longer uses ts, avoiding inconsistency with the Connector time column configuration.
Configure Rule Engine
Rule SQL:
SELECT
  timestamp,
  payload.machine_id as machine_id,
  payload.production_line as production_line,
  payload.temperature as temperature,
  payload.vibration as vibration,
  payload.machine_status as machine_status
FROM "factory/+/metrics"
Action write syntax:
machine_metrics production_line=${production_line},machine_id=${machine_id},temperature=${temperature},vibration=${vibration},machine_status=${machine_status} ${timestamp}
Notes:
- Do not use the old
machine_metrics,tag=value field=valuesyntax. - Do not rename
timestamptots. - Telemetry data is append-only time-series data, so
append_mode='true'is recommended.
Simulate Device Reporting
python3 publisher.py \
  --host xxxx.dedicated.aws.mqttce.net \
  --port 1883 \
  --topic factory/A/metrics \
  --qos 1 \
  --tps 1 \
  --duration-sec 60 \
  --username test \
  --password test
Validate Data Writes
Query the latest data:
SELECT
  "timestamp",
  production_line,
  machine_id,
  temperature,
  vibration,
  machine_status
FROM machine_metrics
ORDER BY "timestamp" DESC
LIMIT 10;
Aggregate historical telemetry data:
SELECT
  machine_id,
  production_line,
  AVG(temperature) AS avg_temperature,
  MAX(temperature) AS max_temperature,
  AVG(vibration) AS avg_vibration,
  MAX(vibration) AS max_vibration,
  COUNT(*) AS sample_count
FROM machine_metrics
GROUP BY machine_id, production_line
ORDER BY max_temperature DESC
LIMIT 10;
Get Real-Time Broker Status
The Python analysis service can obtain real-time status through the EMQX Management API:
GET /api/v5/monitor_current
This API can return:
connectionssubscriptionsreceived_msg_ratesent_msg_raterules_matched_rateactions_executed_rate
Python Analysis Service
The Python service needs to complete four tasks:
- Connect to EMQX Tables with
psycopg2. - Query aggregated data from
machine_metrics. - Call
/monitor_currentwithrequeststo obtain the current Broker status. - Use the OpenAI Agents SDK to call an OpenAI-compatible API and generate diagnostic results.
The key code structure is as follows:
from agents import Agent, OpenAIChatCompletionsModel, Runner
from openai import AsyncOpenAI

client = AsyncOpenAI(
    api_key=os.environ["DASHSCOPE_API_KEY"],
    base_url="https://dashscope.aliyuncs.com/compatible-mode/v1",
)

model = OpenAIChatCompletionsModel(
    model=os.environ.get("DASHSCOPE_MODEL", "qwen-plus"),
    openai_client=client,
)

agent = Agent(
    name="IoT Operations Analyst",
    instructions="Analyze MQTT and IoT telemetry data and provide actionable maintenance recommendations.",
    model=model,
)

result = Runner.run_sync(agent, prompt)
print(result.final_output)
SSL must be enabled when connecting to EMQX Tables:
conn = psycopg2.connect(
    host=os.environ["TABLES_HOST"],
    port=4003,
    database="public",
    user=os.environ["TABLES_USER"],
    password=os.environ["TABLES_PASSWORD"],
    sslmode="require",
)
If sslmode="require" is not configured, the EMQX Tables PostgreSQL connection will fail.
Run the Analysis Service
Configure EMQX Tables:
export TABLES_HOST='your-tables-host'
export TABLES_PORT='4003'
export TABLES_DATABASE='public'
export TABLES_USER='your-tables-username'
export TABLES_PASSWORD='your-tables-password'
export TABLES_SSLMODE='require'
Configure the EMQX API:
export EMQX_API_BASE='https://xxxx.dedicated.aws.mqttce.net:8443/api/v5'
export EMQX_APP_ID='your-app-id'
export EMQX_APP_SECRET='your-app-secret'
Configure the model API:
export DASHSCOPE_API_KEY='your-dashscope-api-key'
export DASHSCOPE_BASE_URL='https://dashscope.aliyuncs.com/compatible-mode/v1'
export DASHSCOPE_MODEL='qwen-plus'
Run:
python iot_ai_analysis_agent.py
Validation Results
In actual validation, the following path was verified:
- Python dependencies were installed successfully:
openai,openai-agents,psycopg2-binary, andrequests. - Python can connect to EMQX Tables with
sslmode=require. - Aggregation SQL can query real historical telemetry data.
/monitor_currentcan obtain current Broker status.- The OpenAI Agents SDK can be imported normally and used to construct an Agent.
Example aggregation result:
Machine M998 - Production Line A1
Average Temperature: 91.20
Maximum Temperature: 91.20
Average Vibration: 1.420
Maximum Vibration: 1.42
Sample Count: 1

Machine M999 - Production Line A1
Average Temperature: 88.50
Maximum Temperature: 88.50
Average Vibration: 1.350
Maximum Vibration: 1.35
Sample Count: 1
AI output usually includes:
- Factory Health Assessment
- High Risk Machines
- Trend Analysis
- Possible Root Causes
- Maintenance Recommendations
Notes
- SSL must be enabled for the EMQX Tables PostgreSQL connection.
DASHSCOPE_API_KEYis an external model service credential and must be configured by the customer.- If no model API Key is configured, you can first validate the Tables query and Prompt construction.
- Do not write API Keys directly into code in production. Use environment variables or a Secret Manager.
Summary
By combining EMQX Tables with the OpenAI Agents SDK, IoT telemetry can be transformed from raw data into intelligent operational insights.
The solution enables AI-driven device health assessment, anomaly analysis, risk identification, and automated recommendations, helping teams move from simply monitoring devices to understanding and optimizing their operations.