Seamlessly Integrating EMQX with Datadog for Efficient Monitoring

Introduction
Datadog is a cloud-based observability and security platform that offers automated infrastructure monitoring, application performance monitoring, log management, and real-user monitoring. It unifies these capabilities into a real-time application solution, enabling developers to easily monitor, analyze, and optimize performance and reliability.
Recently, EMQX officially integrated with Datadog, allowing users to leverage Datadog for collecting metrics related to device connectivity, message throughput, latency, and node performance. This integration enhances users’ ability to understand their services’ current state and troubleshoot system performance issues, facilitating the development of efficient, reliable IoT applications.
In this blog, we will guide you through the process of integrating EMQX with Datadog in four simple steps.
Step 1: Install the Datadog Agent
Begin by creating a Datadog account and logging in to the Datadog console.
Next, install the Datadog Agent on the server where EMQX is hosted. The Agent collects EMQX metrics and sends them to the Datadog cloud.
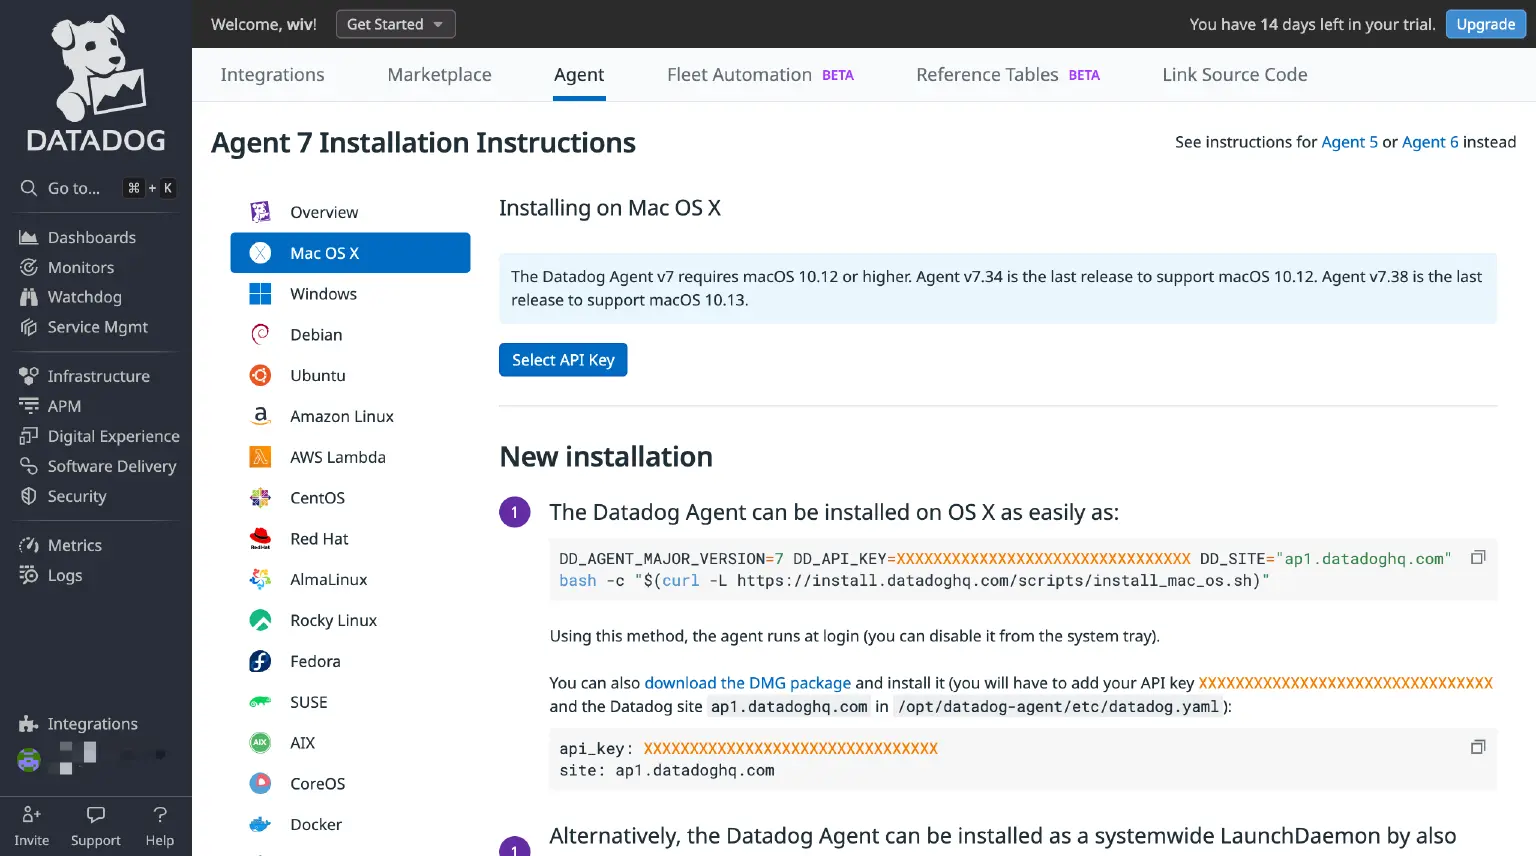
Deploy the Datadog Agent on the server where the EMQX cluster resides or on a server with access to the EMQX nodes. If you haven’t installed the Agent yet, follow these steps:
- Navigate to Integrations → Agent in the menu bar to access the Agent Installation Instructions page.
- Choose your operating system version and follow the provided instructions.
Step 2: Add EMQX Integration to Datadog
EMQX offers out-of-box Datadog integration that can be easily incorporated into your Datadog console by following these steps:
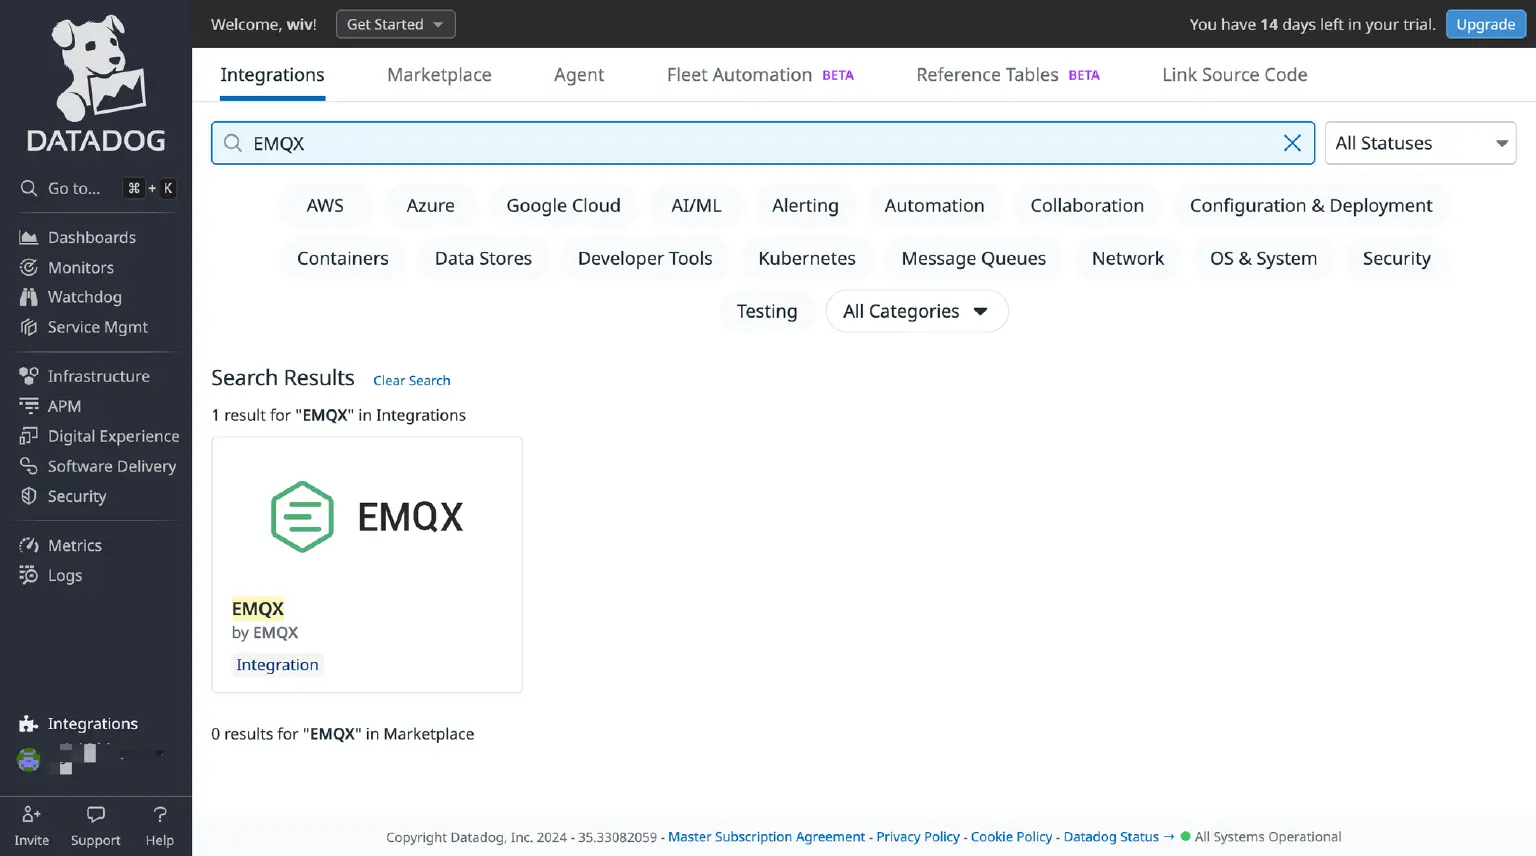
- Open your Datadog console and navigate to Integrations → Integrations in the menu bar.
- In the Search Integrations box, type “EMQX” to find the integration with the same name and author.
- Click the Install Integration button in the upper right corner of the pop-up box to add the EMQX integration to Datadog.
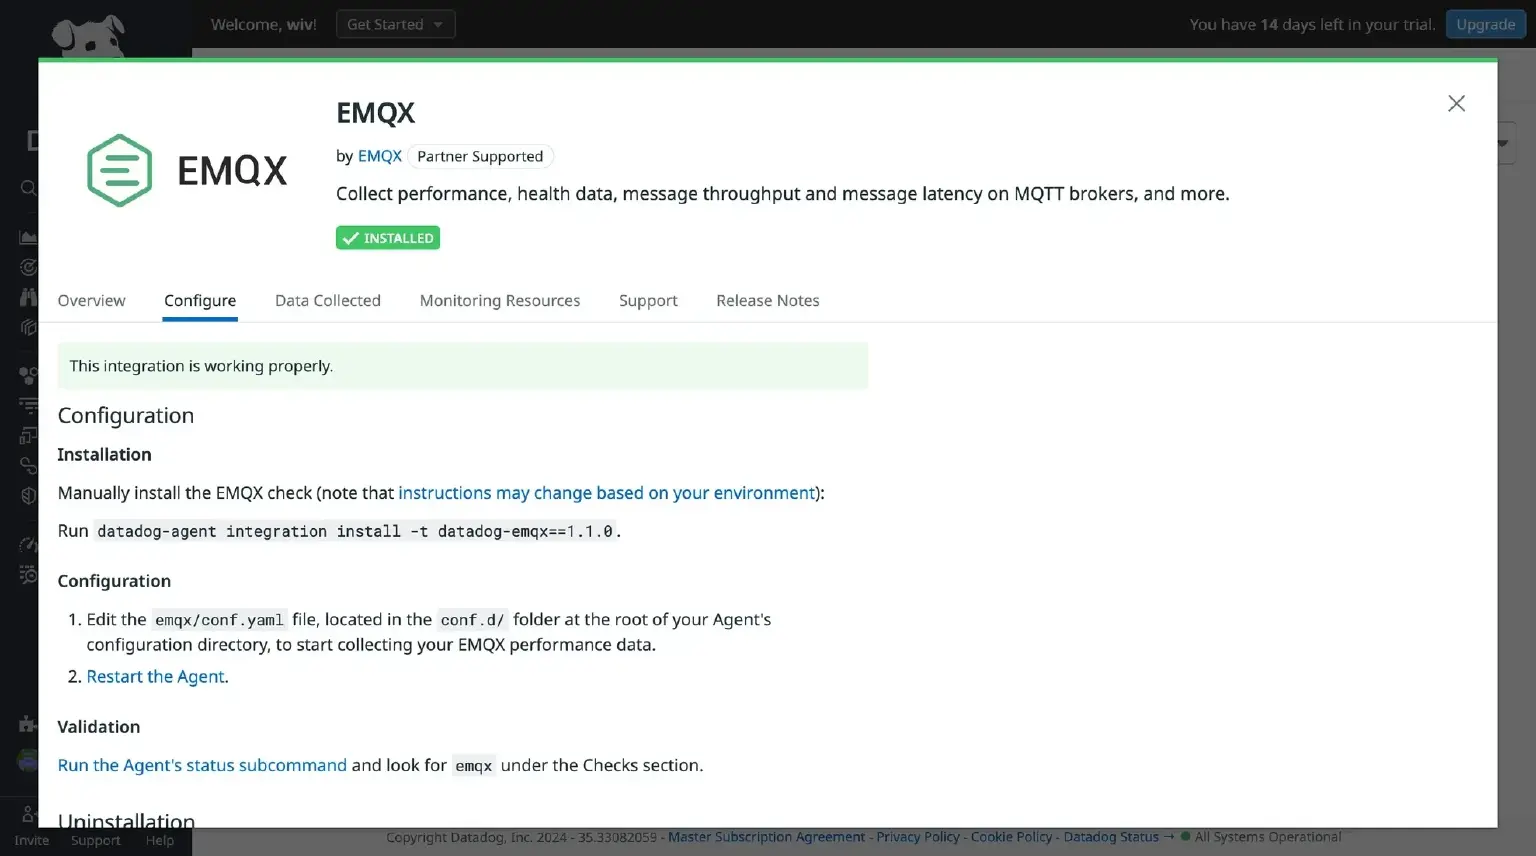
- After completing the installation, navigate to the Configure tab to access the configuration guidelines for the EMQX integration. The necessary configuration steps are carried out within the Datadog Agent.
Step 3: Add and Enable EMQX Integration on Datadog Agent
Following the configuration guidelines, add the EMQX integration to the Datadog Agent to configure the collection and reporting of EMQX metrics.
- Execute the following command on the server where the Datadog Agent is hosted to add the EMQX integration. Note that this example uses version 1.1.0; always refer to the latest guidelines for the appropriate version:
datadog-agent integration install -t datadog-emqx==1.1.0 - Once the installation is complete, proceed to modify the Agent configuration file to enable EMQX integration:
Navigate to the Agent configuration directory (usually located at /opt/datadog-agent/etc/conf.d/). Locate the emqx.d directory within this directory. You’ll find a sample configuration file named conf.yaml.example in the emqx.d directory.
Create a copy of this file in the same directory and rename it to conf.yaml. Edit the conf.yaml file, adjusting the following configuration item:instances: - openmetrics_endpoint: http://localhost:18083/api/v5/prometheus/stats?mode=all_nodes_aggregated
Theopenmetrics_endpointspecifies the address from which the Datadog Agent extracts metrics data in OpenMetrics format. In this case, it’s set to the HTTP API address of EMQX. Make sure to replace this with an address accessible by the Datadog Agent.
The API also allows specifying the range of metrics to pull via themodequery parameter. The meaning of each parameter is as follows: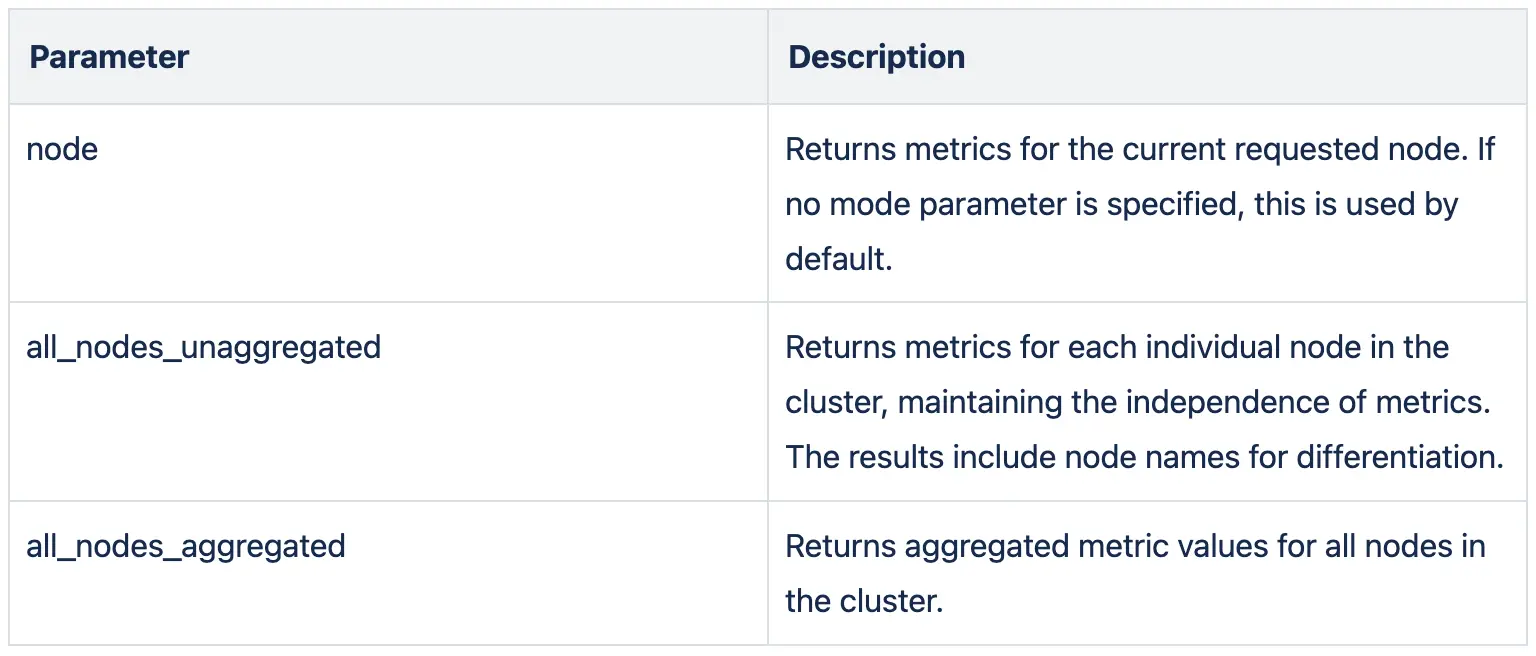
For a unified view, use themode=all_nodes_aggregatedoption. This ensures that the Datadog control sees values for the entire EMQX cluster. - To restart the Datadog Agent on macOS, follow these steps:
launchctl stop com.datadoghq.agent launchctl start com.datadoghq.agent - After rebooting your system, use the following command to verify if the EMQX integration is successfully enabled. If you see “Instance ID: ... OK”, it indicates that the integration has been successfully enabled.
$ datadog-agent status | grep emqx -A 4
    emqx (1.1.0)
    ------------
      Instance ID: emqx:1865f3a06d300ccc [OK]
      Configuration Source: file:/opt/datadog-agent/etc/conf.d/emqx.d/conf.yaml
      Total Runs: 17
      Metric Samples: Last Run: 166, Total: 2,822
      Events: Last Run: 0, Total: 0
      Service Checks: Last Run: 1, Total: 17
      Average Execution Time : 43ms
      Last Execution Date : 2024-05-11 17:35:41 CST / 2024-05-11 09:35:41 UTC (1715420141000)
      Last Successful Execution Date : 2024-05-11 17:35:41 CST / 2024-05-11 09:35:41 UTC (1715420141000)
At this point, you’ve completed all the necessary configurations on the Datadog Agent. The Agent will now periodically collect EMQX runtime data and send them to Datadog. Next, let’s check the Datadog console to ensure that the metrics are being collected correctly.
Step 4: View EMQX Metrics on the Datadog Console
The Datadog Agent’s EMQX integration provides a ready-to-use dashboard chart that displays node status, message status, and other more in-depth observability metrics. You can follow these steps to utilize it:
- Open the Datadog console and navigate to Integrations → Integrations in the menu bar.
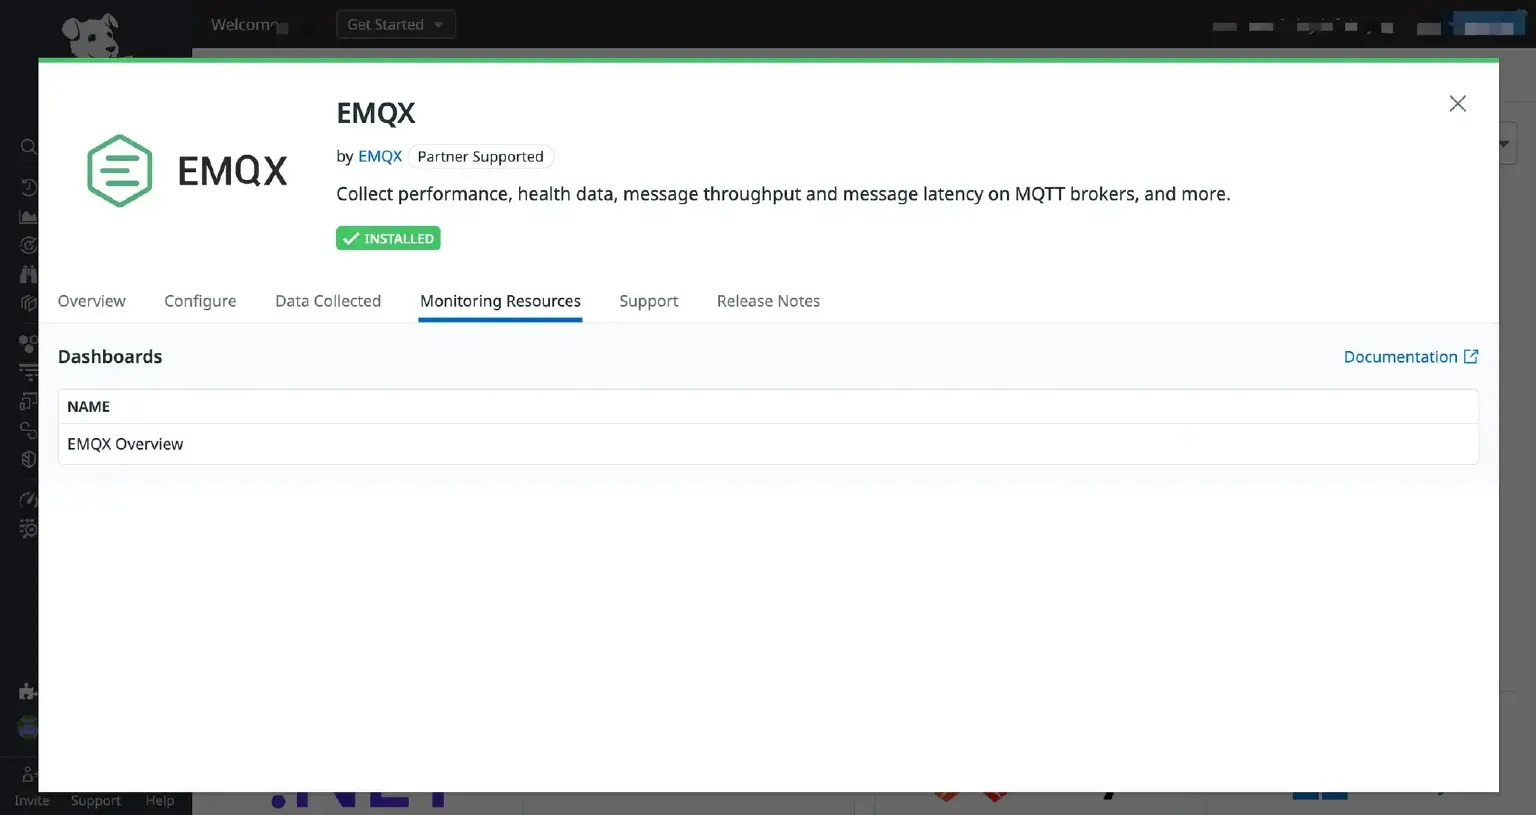
- Locate the installed EMQX integration and click to open it.
- Switch to the Monitoring Resources tab within the pop-up box to open the EMQX Overview charts under Dashboards.
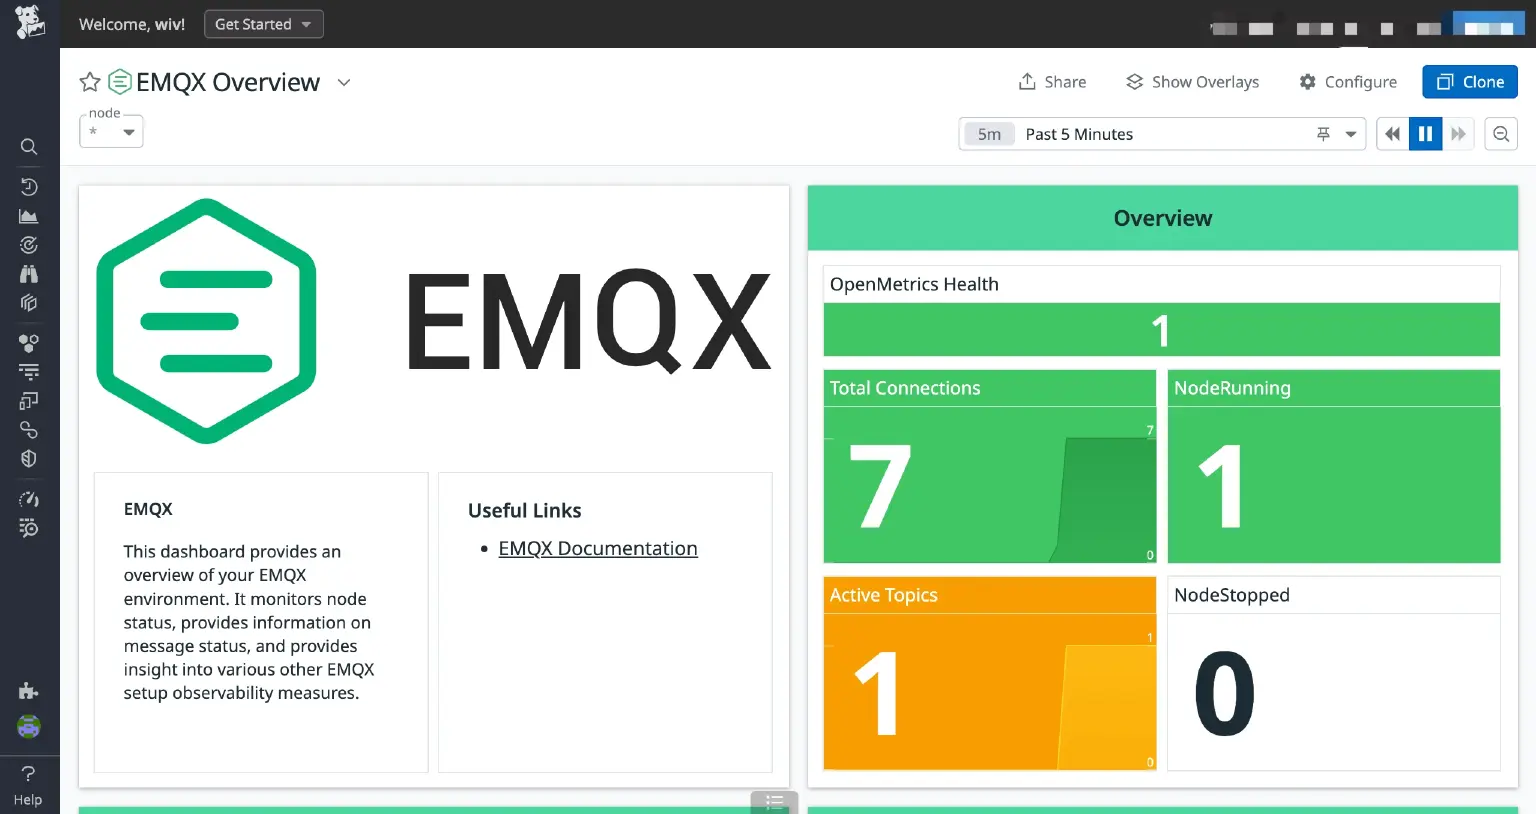
The charts provide the following information:
- OpenMetrics Health: The number of active metrics collectors.
- Total Connections: The overall count of connections, including those that remain the sessions despite being disconnected.
- NodeRunning: The quantity of running nodes within the cluster.
- Active Topics: The number of currently active topics.
- NodeStopped: The count of stopped nodes in the cluster.
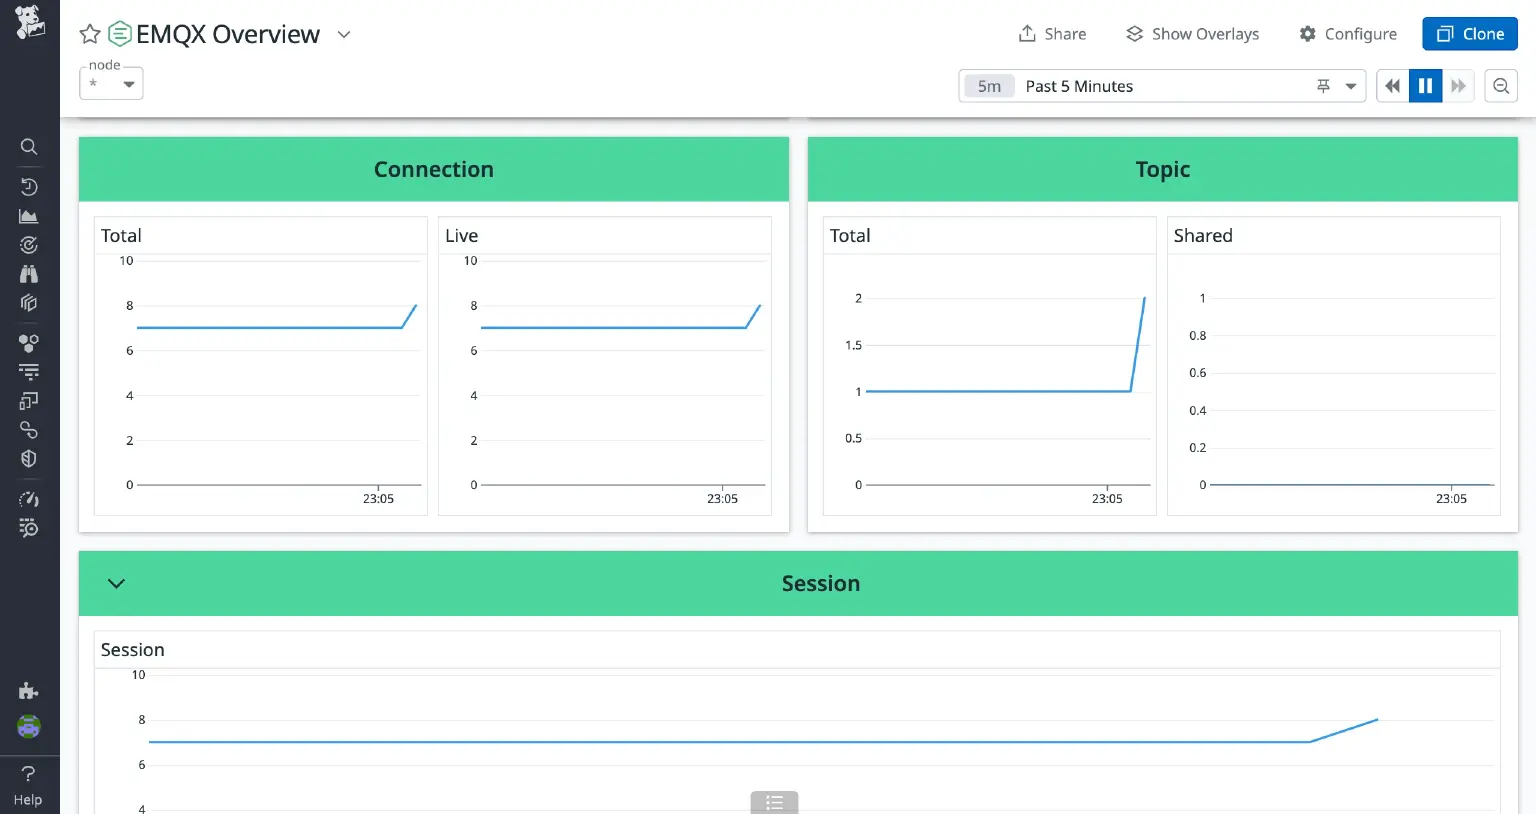
- Connection
- Total: The total number of connections, including those that maintain the session even when disconnected.
- Live: The number of actively maintained TCP connections.
- Topic
- Total: The overall number of topics.
- Shared: The count of shared topics.
- Session: The total number of sessions.
- Erlang VM: The CPU, memory, and queue usage of the Erlang virtual machine.
- Retainer & Delayed
- Retained: The number of retained messages.
- Delayed: The count of delayed messages.
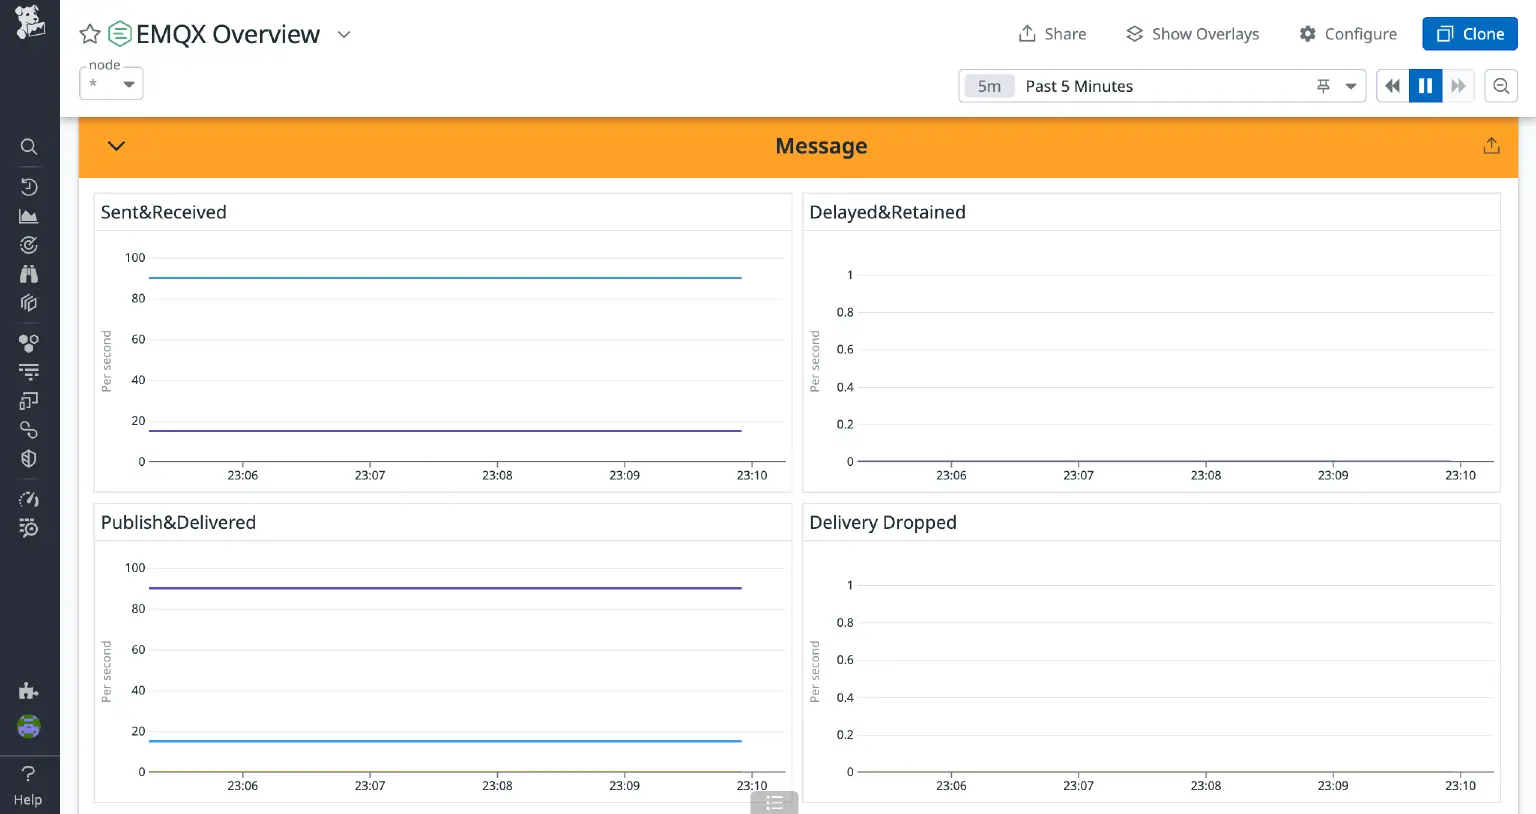
- Message
- Sent & Received: The rate of sent and received messages.
- Delayed & Retained: The rate of delayed and retained messages.
- Publish & Delivered: The rate of message publishing and delivery.
- Delivery Dropped: The number of delivered messages that were dropped.
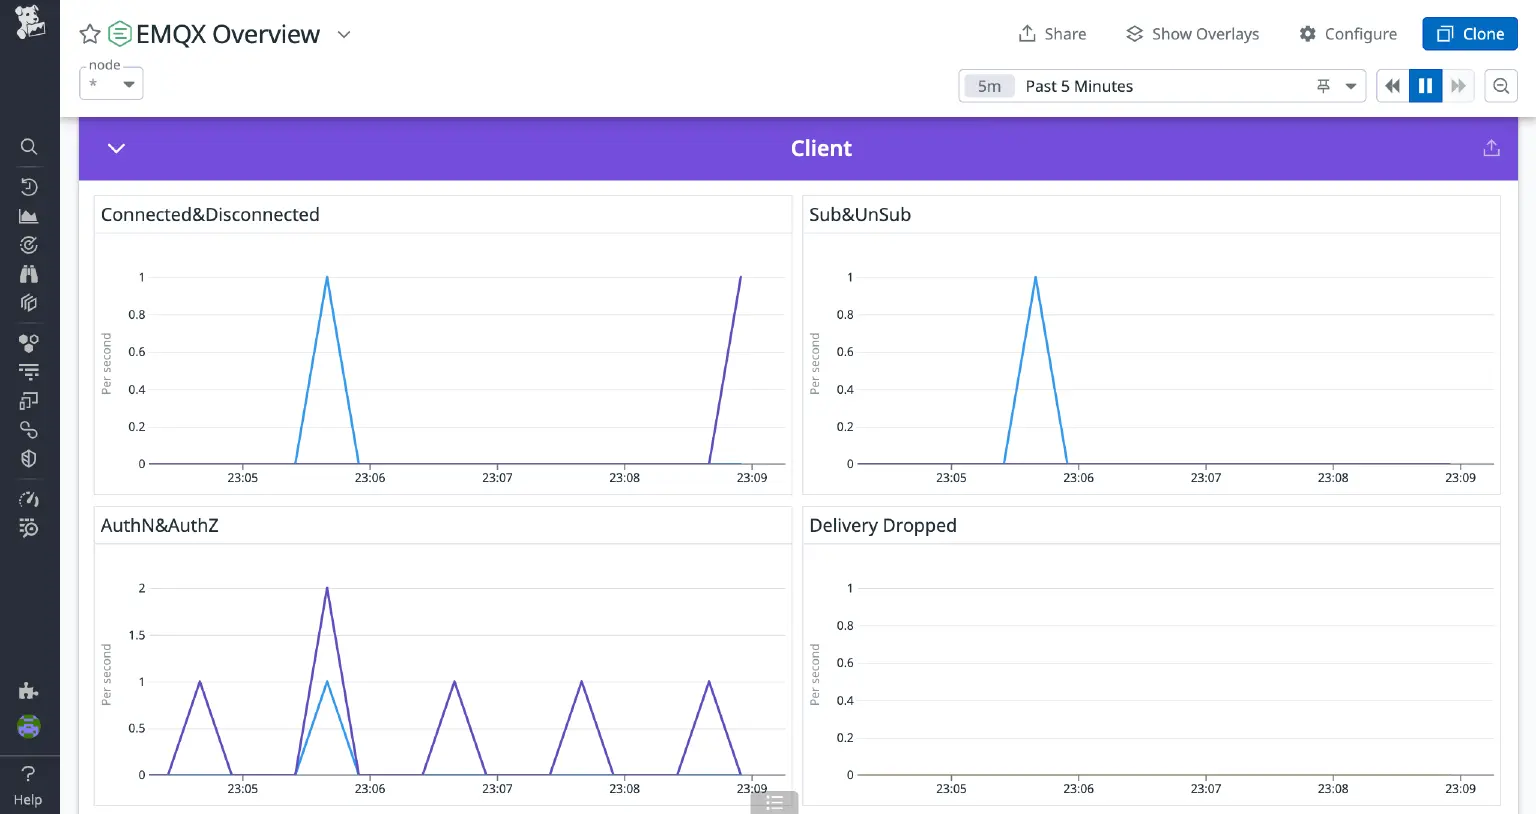
- Client
- Connected & Disconnected: The rate of connections being established and terminated.
- Sub & UnSub: The subscription and unsubscription rates.
- AuthN & AuthZ: Information on authentication and authorization rates.
- Delivery Dropped: The number of dropped delivery messages.
- Mria: The total number of Mria transactions.
Below are screenshots of some of the charts; the values dynamically change based on load of EMQX and client activity.
Next Steps
The charts built into Datadog’s EMQX integration show only some of the key metrics. You can also refer to this document to access all the reported EMQX metrics and create your own monitoring charts based on them.
Next, you can configure alert rules in Datadog based on these metrics. When certain metrics reach preset thresholds or abnormal situations occur, Datadog will send notifications to remind you to take necessary actions promptly, minimizing the impact of system failures on your business.
Conclusion
This blog showcased how to seamlessly integrate EMQX with Datadog, enabling real-time monitoring of EMQX’s operational status. By leveraging EMQX’s established metrics and Datadog’s robust features, users can track critical aspects such as connection counts, message rates, and node status. Identifying potential issues promptly allows for timely corrective actions, ensuring system stability and reliability. We hope this article serves as a valuable reference for users who use Datadog to monitor EMQX.