Kuiper has officially become the EdgeX rule engine
Overview
In EdgeX Geneva, EMQX Kuiper - an SQL based rule engine is integrated with EdgeX. Before diving into this tutorial, let's spend a little time on learning basic knowledge of Kuiper. Kuiper is an edge lightweight IoT data analytics / streaming software implemented by Golang, and it can be run at all kinds of resource constrained edge devices. Kuiper rules are based on Source, SQL and Sink.
- Source: The data source of streaming data, such as data from MQTT broker. In EdgeX scenario, the data source is EdgeX message bus, which could be ZeroMQ or MQTT broker.
- SQL: SQL is where you specify the business logic of streaming data processing. Kuiper provides SQL-like statements to allow you to extract, filter & transform data.
- Sink: Sink is used for sending analysis result to a specified target. For example, send analysis result to another MQTT broker, or an HTTP rest address.
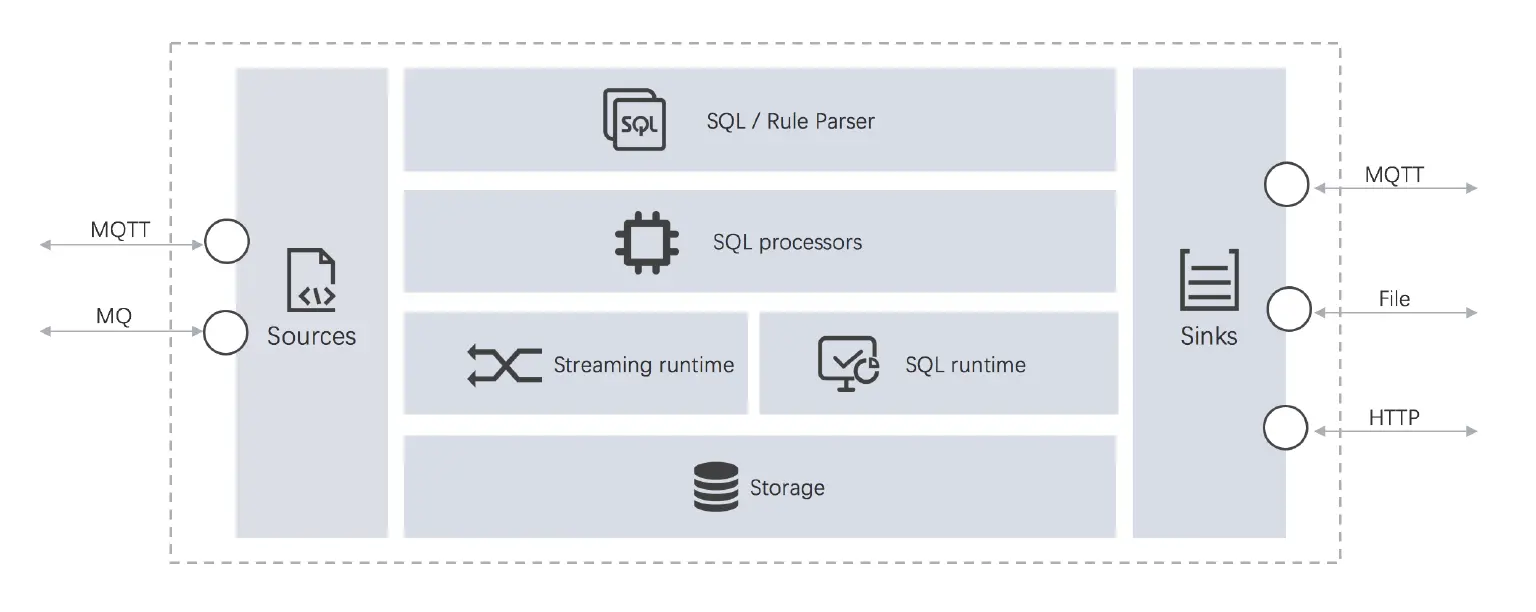
Following three steps are required for using Kuiper.
- Create a stream, where you specify the data source.
- Write a rule.
- Write a SQL for data analysis
- Specify a sink target for saving analysis result
- Deploy and run rule.
The tutorial demonstrates how to use Kuiper to process the data from EdgeX message bus.
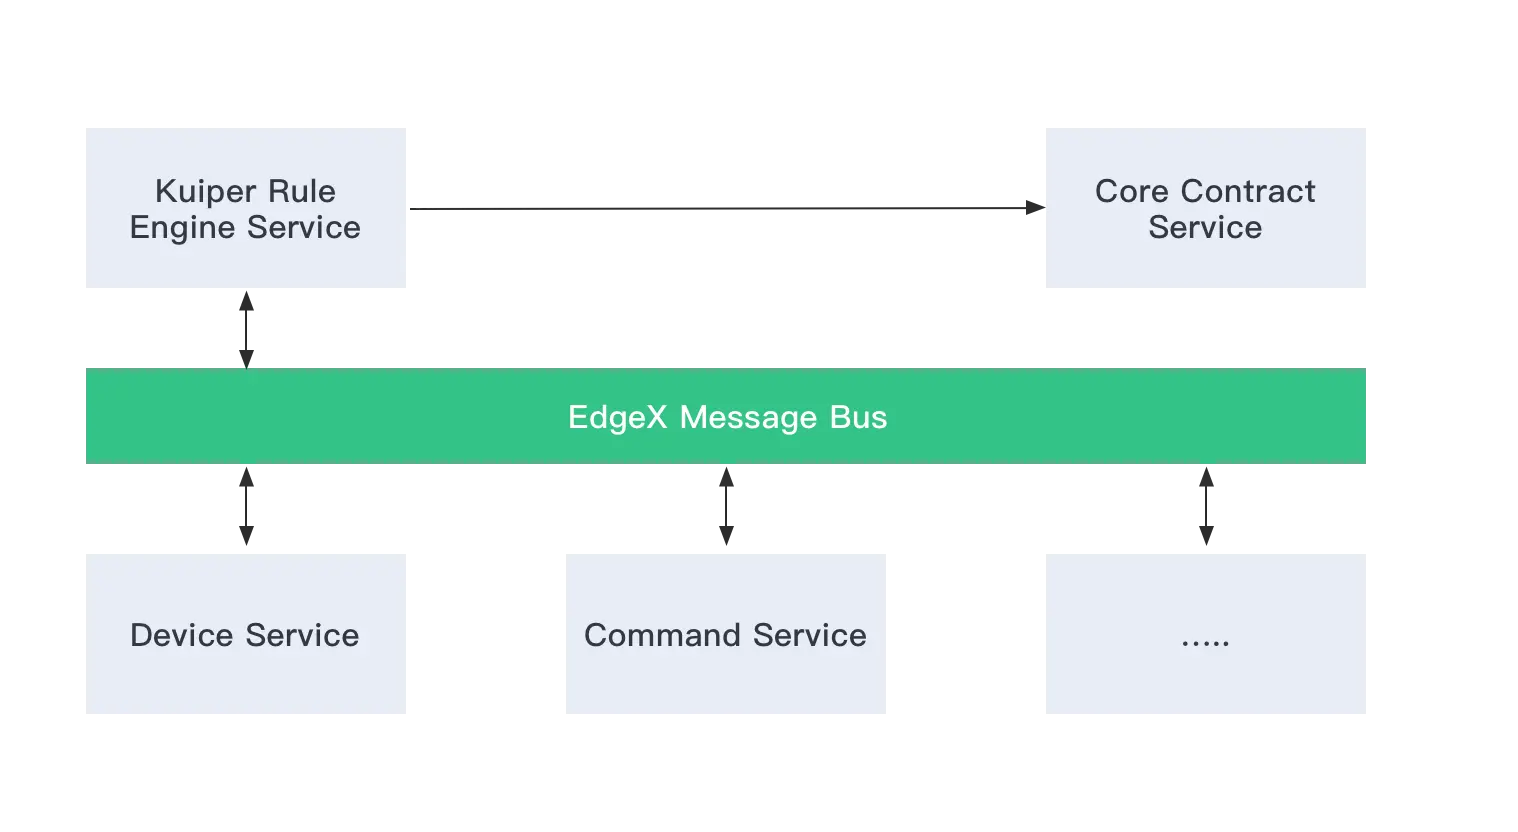
Kuiper EdgeX integration
EdgeX uses message bus to exchange information between different micro services. It contains the abstract message bus interface and implementations for ZeroMQ & MQTT. The integration work for Kuiper & EdgeX includes following 3 parts.
- An EdgeX message bus source is extended to support consuming data from EdgeX message bus.
- To analyze the data, Kuiper need to know data types that passed through it. Generally, user would be better to specify data schema for analysis data when a stream is created. Such as in below, a
demostream has a field namedtemperaturefield. It is very similar to create table schema in relational database system. After creating the stream definition, Kuiper can perform type checking during compilation or runtime, and invalid SQLs or data will be reported to user.CREATE STREAM demo (temperature bigint) WITH (FORMAT="JSON"...)
However, data type definitions are already specified through EdgeXCore contract Service, and to improve the using experience, user are NOT necessary to specify data types when creating stream. Kuiper source tries to load all ofvalue descriptorsfromCore contract Serviceduring initialization of a rule (so now if you have any updated value descriptors, you will have to restart the rule), then if with any data sending from message bus, it will be converted into corresponding data types. - An EdgeX message bus sink is extended to support send analysis result back to EdgeX Message Bus. User can also choose to send analysis result to RestAPI, Kuiper already supported it.
Start to use
In out tutorial, we will use Random Integer Device Service which is shipped in official EdgeX release, and run rules against the data generated by this sample device service.
Run EdgeX Docker instances
Go to EdgeX develop-scripts project, and download related Docker compose file for Geneva release, then bring up EdgeX Docker instances.
$ docker-compose -f ./docker-compose-nexus-redis-no-secty.yml up -d --build
After all of the Docker instances are started, you can use docker ps command to verify all of services are running correctly.
$ docker ps
CONTAINER ID        IMAGE                                                                  COMMAND                  CREATED             STATUS              PORTS                                                                                              NAMES
5618c93027a9        nexus3.edgexfoundry.org:10004/docker-device-virtual-go:master          "/device-virtual --p…"   37 minutes ago      Up 37 minutes       0.0.0.0:49990->49990/tcp                                                                           edgex-device-virtual
fabe6b9052f5        nexus3.edgexfoundry.org:10004/docker-edgex-ui-go:master                "./edgex-ui-server"      37 minutes ago      Up 37 minutes       0.0.0.0:4000->4000/tcp                                                                             edgex-ui-go
950135a7041d        emqx/kuiper:0.3.1                                                      "/usr/bin/docker-ent…"   37 minutes ago      Up 37 minutes        0.0.0.0:20498->20498/tcp, 9081/tcp, 0.0.0.0:48075->48075/tcp                                       edgex-kuiper
c49b0d6f9347        nexus3.edgexfoundry.org:10004/docker-support-scheduler-go:master       "/support-scheduler …"   37 minutes ago      Up 37 minutes       0.0.0.0:48085->48085/tcp                                                                           edgex-support-scheduler
4265dcc2bb48        nexus3.edgexfoundry.org:10004/docker-core-command-go:master            "/core-command -cp=c…"   37 minutes ago      Up 37 minutes       0.0.0.0:48082->48082/tcp                                                                           edgex-core-command
4667160e2f41        nexus3.edgexfoundry.org:10004/docker-app-service-configurable:master   "/app-service-config…"   37 minutes ago      Up 37 minutes       48095/tcp, 0.0.0.0:48100->48100/tcp                                                                edgex-app-service-configurable-rules
9bbfe95993f5        nexus3.edgexfoundry.org:10004/docker-core-metadata-go:master           "/core-metadata -cp=…"   37 minutes ago      Up 37 minutes       0.0.0.0:48081->48081/tcp, 48082/tcp                                                                edgex-core-metadata
2e342a3aae81        nexus3.edgexfoundry.org:10004/docker-support-notifications-go:master   "/support-notificati…"   37 minutes ago      Up 37 minutes       0.0.0.0:48060->48060/tcp                                                                           edgex-support-notifications
3cfc628e013a        nexus3.edgexfoundry.org:10004/docker-sys-mgmt-agent-go:master          "/sys-mgmt-agent -cp…"   37 minutes ago      Up 37 minutes       0.0.0.0:48090->48090/tcp                                                                           edgex-sys-mgmt-agent
f69e9c4d6cc8        nexus3.edgexfoundry.org:10004/docker-core-data-go:master               "/core-data -cp=cons…"   37 minutes ago      Up 37 minutes       0.0.0.0:5563->5563/tcp, 0.0.0.0:48080->48080/tcp                                                   edgex-core-data
9e5091928409        nexus3.edgexfoundry.org:10004/docker-support-logging-go:master         "/support-logging -c…"   37 minutes ago      Up 37 minutes       0.0.0.0:48061->48061/tcp                                                                           edgex-support-logging
74e8668f892c        redis:5.0.7-alpine                                                     "docker-entrypoint.s…"   37 minutes ago      Up 37 minutes       0.0.0.0:6379->6379/tcp                                                                             edgex-redis
9b341bb217f9        consul:1.3.1                                                           "docker-entrypoint.s…"   37 minutes ago      Up 37 minutes       0.0.0.0:8400->8400/tcp, 8300-8302/tcp, 8301-8302/udp, 8600/tcp, 8600/udp, 0.0.0.0:8500->8500/tcp   edgex-core-consul
ed7ad5ae08b2        nexus3.edgexfoundry.org:10004/docker-edgex-volume:master               "/bin/sh -c '/usr/bi…"   37 minutes ago      Up 37 minutes                                                                                                          edgex-files
Create a stream
There are two approaches to manage stream, you can use your preferred approach.
Option 1: Use Rest API
Notice: Rest API of Kuiper in EdgeX uses 48075 instead of default 9081. So please change 9081 to 48075 in all of documents when you use EdgeX Kuiper Rest API.
The next step is to create a stream that can consume data from EdgeX message bus. Please change $kuiper_docker to Kuiper docker instance IP address.
curl -X POST \
  http://$kuiper_docker:48075/streams \
  -H 'Content-Type: application/json' \
  -d '{
  "sql": "create stream demo() WITH (FORMAT=\"JSON\", TYPE=\"edgex\")"
}'
For other Rest APIs, please refer to this doc.
Option 2: Use Kuiper CLI
Run following command to enter the running Kuiper docker instance.
docker exec -it edgex-kuiper /bin/sh
Use following command to create a stream named demo.
bin/cli create stream demo'() WITH (FORMAT="JSON", TYPE="edgex")'
For other command line tools, please refer to this doc.
Now the stream is created. But you maybe curious about how Kuiper knows the message bus IP address & port, because such information are not specified in CREATE STREAM statement. Those configurations are managed in etc/sources/edgex.yaml , you can type cat etc/sources/edgex.yaml command to take a look at the contents of file. If you have different server, ports & service server configurations, please update it accordingly. As mentioned previously, these configurations could be overrode when bring-up the Docker instances.
#Global Edgex configurations
default:
  protocol: tcp
  server: localhost
  port: 5566
  topic: events
  serviceServer: http://localhost:48080
.....
For more detailed information of configuration file, please refer to this doc.
Create a rule
Let's create a rule that send result data to an MQTT broker, for detailed information of MQTT sink, please refer to this link. Similar to create a stream, you can also choose REST or CLI to manage rules.
So the below rule will get all of values from event topic. The sink result will
- Published to topic
resultof public MQTT brokerbroker.emqx.io. - Print to log file.
Option 1: Use Rest API
curl -X POST \
  http://$kuiper_server:48075/rules \
  -H 'Content-Type: application/json' \
  -d '{
  "id": "rule1",
  "sql": "SELECT * FROM demo",
  "actions": [
    {
      "mqtt": {
        "server": "tcp://broker.emqx.io:1883",
        "topic": "result",
        "clientId": "demo_001"
      }
    },
    {
      "log":{}
    }
  ]
}
Option 2: Use Kuiper CLI
You can create a rule file with any text editor, and copy following contents into it. Let's say the file name is rule.txt.
{
  "sql": "SELECT * from demo",
  "actions": [
    {
      "mqtt": {
        "server": "tcp://broker.emqx.io:1883",
        "topic": "result",
        "clientId": "demo_001"
      }
    },
    {
      "log":{}
    }
  ]
}
In the running Kuiper instance, and execute following command.
$ bin/cli create rule rule1 -f rule.txt
Connecting to 127.0.0.1:20498...
Creating a new rule from file rule.txt.
Rule rule1 was created successfully, please use 'cli getstatus rule rule1' command to get rule status.
If you want to send analysis result to another sink, please refer to other sinks that supported in Kuiper.
Now you can also take a look at the log file under log/stream.log, or through command docker logs edgex-kuiper to see detailed info of rule.
time="2020-04-17T06:32:24Z" level=info msg="Serving kuiper (version - 0.3.1-4-g9e63fe1) on port 20498, and restful api on port 9081. \n" file="server.go:101"
time="2020-04-17T06:32:24Z" level=info msg="The connection to edgex messagebus is established successfully." file="edgex_source.go:95" rule=rule1
time="2020-04-17T06:32:24Z" level=info msg="Successfully subscribed to edgex messagebus topic events." file="edgex_source.go:104" rule=rule1
time="2020-04-17T06:32:24Z" level=info msg="The connection to server tcp://broker.emqx.io:1883 was established successfully" file="mqtt_sink.go:161" rule=rule1
time="2020-04-17T06:32:25Z" level=info msg="Get 24 of value descriptors from service." file="edgex_source.go:223"
time="2020-04-17T06:32:25Z" level=info msg="sink result for rule rule1: [{\"int32\":-697766590}]" file="log_sink.go:16" rule=rule1
time="2020-04-17T06:32:25Z" level=info msg="sink result for rule rule1: [{\"int8\":-47}]" file="log_sink.go:16" rule=rule1
time="2020-04-17T06:32:25Z" level=info msg="sink result for rule rule1: [{\"int16\":-318}]" file="log_sink.go:16" rule=rule1
time="2020-04-17T06:32:25Z" level=info msg="sink result for rule rule1: [{\"int64\":-8680421421398846880}]" file="log_sink.go:16" rule=rule1
time="2020-04-17T06:32:31Z" level=info msg="sink result for rule rule1: [{\"bool\":true}]" file="log_sink.go:16" rule=rule1
...
Monitor analysis result
Since all of the analysis result are published to tcp://broker.emqx.io:1883, so you can just use below mosquitto_sub command to monitor the result. You can also use other MQTT client tools.
$ mosquitto_sub -h broker.emqx.io -t result
[{"bool":true}]
[{"bool":false}]
[{"bool":true}]
[{"randomvalue_int16":3287}]
[{"float64":8.41326e+306}]
[{"randomvalue_int32":-1872949486}]
[{"randomvalue_int8":-53}]
[{"int64":-1829499332806053678}]
[{"int32":-1560624981}]
[{"int16":8991}]
[{"int8":-4}]
[{"bool":true}]
[{"bool":false}]
[{"float64":1.737076e+306}]
You can also type below command to look at the rule execution status. The corresponding REST API is also available for getting rule status, please check related document.
# bin/cli getstatus rule rule1
Connecting to 127.0.0.1:20498...
{
  "source_demo_0_records_in_total": 29,
  "source_demo_0_records_out_total": 29,
  "source_demo_0_exceptions_total": 0,
  "source_demo_0_process_latency_ms": 0,
  "source_demo_0_buffer_length": 0,
  "source_demo_0_last_invocation": "2020-04-17T10:30:09.294337",
  "op_preprocessor_demo_0_records_in_total": 29,
  "op_preprocessor_demo_0_records_out_total": 29,
  "op_preprocessor_demo_0_exceptions_total": 0,
  "op_preprocessor_demo_0_process_latency_ms": 0,
  "op_preprocessor_demo_0_buffer_length": 0,
  "op_preprocessor_demo_0_last_invocation": "2020-04-17T10:30:09.294355",
  "op_filter_0_records_in_total": 29,
  "op_filter_0_records_out_total": 21,
  "op_filter_0_exceptions_total": 0,
  "op_filter_0_process_latency_ms": 0,
  "op_filter_0_buffer_length": 0,
  "op_filter_0_last_invocation": "2020-04-17T10:30:09.294362",
  "op_project_0_records_in_total": 21,
  "op_project_0_records_out_total": 21,
  "op_project_0_exceptions_total": 0,
  "op_project_0_process_latency_ms": 0,
  "op_project_0_buffer_length": 0,
  "op_project_0_last_invocation": "2020-04-17T10:30:09.294382",
  "sink_sink_mqtt_0_records_in_total": 21,
  "sink_sink_mqtt_0_records_out_total": 21,
  "sink_sink_mqtt_0_exceptions_total": 0,
  "sink_sink_mqtt_0_process_latency_ms": 0,
  "sink_sink_mqtt_0_buffer_length": 1,
  "sink_sink_mqtt_0_last_invocation": "2020-04-17T10:30:09.294423"
}
Summary
In this tutorial, we introduce a very simple use of EdgeX Kuiper rule engine. If having any issues regarding to use of Kuiper rule engine, you can open issues in EdgeX or Kuiper Github respository.
More Exercise
Current rule does not filter any data that are sent to Kuiper, so how to filter data? Please drop rule and change the SQL in previous rule accordingly. After update the rule file, and then deploy the rule again. Please monitor the result topic of MQTT broker, and please verify see if the rule works or not.
Extended Reading
- Read EdgeX source for more detailed information of configurations and data type conversion.
- How to use meta function to extract additional data from EdgeX message bus? There are some other information are sent along with device service, such as event created time, event id etc. If you want to use such metadata information in your SQL statements, please refer to this doc.
- EdgeX message bus sink doc. The document describes how to use EdgeX message bus sink. If you'd like to send the analysis result into message bus, you are probably interested in this article.
If you want to explore more features of EMQX Kuiper, please refer to below resources.