Open Manufacturing Hub: A Reference Architecture for Industrial IoT (IIoT)
Introduction
In the rapidly evolving landscape of the Industrial Internet of Things (IIoT), the demand for seamless connectivity, real-time data processing, and efficient system management has never been greater. As industries continue to embrace the transformative potential of interconnected devices, the need for a robust and flexible technology stack becomes paramount.
Enter the OMH(Open Manufacturing Hub) — an open-source blueprint for industrial IoT presented by EMQ, harnessing the true potential of industrial connectivity and real-time data. In this article, we embark on a journey through the OMH solution, uncovering how to implement this innovative solution and reshape the way we approach industrial system development.

A Comprehensive Solution for Industrial IoT
The OMH provides a comprehensive solution for building powerful and scalable Industrial IoT applications. Together they enable seamless data connectivity, efficient message queuing, and reliable storage and analysis of time-series data.
The objective of the OMH solution is to empower organizations in the manufacturing industry to achieve smart manufacturing excellence. This objective encompasses the utilization of advanced IIoT technologies and data-driven insights to optimize operational processes, enhance productivity, ensure quality, and drive innovation across the manufacturing value chain.
Essential Components of the Architecture
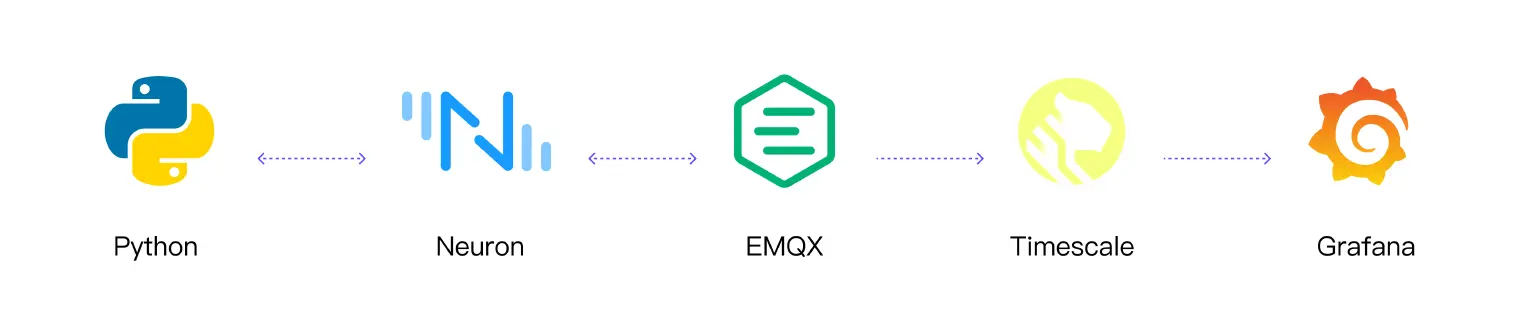
The major components of the OMH are:
- Python Modbus Simulator: A Python application acts as a Modbus simulator, continuously generating Modbus data.
- Neuron Industrial Connectivity Server: Neuron acts as a device hub for industrial connectivity, facilitating seamless integration between diverse industrial protocols and IIoT system.
- EMQX MQTT Broker: The EMQX broker serves as the heart of the IIoT infrastructure, providing a reliable and scalable messaging system for applications.
- Timescale Database: Timescale is a time-series database and provides an ideal solution for storing and analyzing vast amounts of time-series data generated by Python simulator.
- Grafana Visualization: Grafana, a popular open-source data visualization platform, seamlessly integrates with Timescale to provide real-time and historical data visualization.
Businesses can achieve a range of benefits by using the technology stack above. It provides real-time insights to optimize industrial processes, improve operational efficiency, and make better decisions. As a result, businesses can increase their revenue, reduce time to market, lower operational costs, and improve product quality across various industries.
The Workflow of the Architecture
It is pretty easy to build an efficient and scalable IIoT system using EMQX and Neuron. All software components are running in separate Docker containers, with the exception of the Python Modbus Simulator. The simulator is a provided program used to generate data for the demonstration.
In the Modbus simulator, a Python program generates two random sample values for temperature and humidity, which are stored in Modbus registers 400001 and 400002, respectively. Neuron, as the industrial connectivity server, is configured to access these two Modbus registers at regular intervals of 1 second. Neuron then converts the data from the Modbus registers into an MQTT message and publishes it to the EMQX broker.
EMQX, the MQTT broker, efficiently handles the incoming data and forwards it to the TimescaleDB database through the rule engine. The data, representing temperature and humidity values, is then ingested into the TimescaleDB database, which is optimized for time-series data storage.
Finally, Grafana, the data visualization platform, retrieves the time series data from TimescaleDB and uses it to create dynamic visualizations and real-time insights. Users can monitor and analyze the temperature and humidity data in an intuitive and user-friendly manner through Grafana's customizable dashboards.
Demo: Building an Efficient and Scalable IIoT System
Here is a simple setup procedure for all applications mentioned in the infrastructure. The Docker technology would be used to simplify the complexity of installation.
Prerequisite for the Demo Setup
- Docker setup: Visit the Docker website (https://www.docker.com) and download the appropriate Docker version.
- Python3 setup: Visit the official Python website at https://www.python.org/downloads/. On the downloads page, you'll find the latest stable releases of Python.
Docker Compose Installation
Prepare a docker compose file docker_compose.yml for installing the Neuron, EMQX, Timescale and Grafana.
version: '3.4'

services:

  neuron:
    image: emqx/neuron:2.4.8
    ports:
      - "7000:7000"
      - "7001:7001"
    container_name: neuron
    hostname: neuron
    volumes:
      - nng-ipc:/tmp

  emqx:
    image: emqx/emqx-ee:4.4.18
    ports:
      - "1883:1883"
      - "18083:18083"
    container_name: emqx
    hostname: emqx

  timescaledb:
    image: timescale/timescaledb-ha:pg14-latest
    restart: always
    ports:
      - 5432:5432
    container_name: timescaledb
    hostname: timescaledb
    environment:
      POSTGRES_USER: postgres
      POSTGRES_PASSWORD: password
    volumes:
      - /data/timescaledb:/var/lib/postgresql/data

  grafana:
    image: grafana/grafana-enterprise
    container_name: grafana
    hostname: grafana
    restart: unless-stopped
    ports:
     - 3000:3000

volumes:
  nng-ipc:
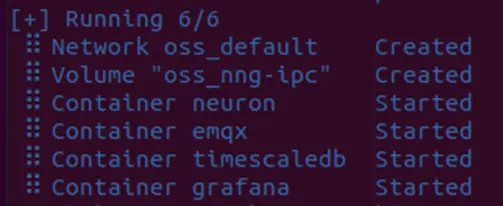
On the same directory, run the docker command to start all docker components with following command:
$ sudo docker compose up -d
This command will launch the services defined in the docker-compose.yml file in detached mode (in the background).
When the above messages received, you successfully run those components in docker environments.
To obtain the docker virtual IP address, run the following command:
$ ifconfig
Note: The diagram has shown that the docker virtual IP address is 172.17.0.1. This IP would be used for hostname parameters in entire demo setup.

Python Modbus Simulator Program
The pymodbus module is used for the simulation program to facilitate Modbus server communication. This Python program allows users to control the data output and generate data automatically as needed. Below is an example code in Python:
#!/usr/bin/env python3

-- coding: utf-8 --

"""
Created on Thu Jun 30 09:54:56 2023

@author: Joey
"""
#!/usr/bin/env python
from pymodbus.version import version
from pymodbus.server import StartTcpServer
from pymodbus.server import StartTlsServer
from pymodbus.server import StartUdpServer
from pymodbus.server import StartSerialServer

from pymodbus.device import ModbusDeviceIdentification
from pymodbus.datastore import ModbusSequentialDataBlock, ModbusSparseDataBlock
from pymodbus.datastore import ModbusSlaveContext, ModbusServerContext

from pymodbus.transaction import ModbusRtuFramer, ModbusBinaryFramer
import time
from threading import Thread
import random
---------------------------------------------------------------------------

configure the service logging

---------------------------------------------------------------------------
import logging
FORMAT = ('%(asctime)-15s %(threadName)-15s'
          ' %(levelname)-8s %(module)-15s:%(lineno)-8s %(message)s')
logging.basicConfig(format=FORMAT)
log = logging.getLogger()
log.setLevel(logging.DEBUG)

def data_change(name,s):
    a = 0
    while True:
        data = [a]*2
        data[0] = int(280 + random.random()*30)
        data[1] = int(700 + random.random()*30)
        s.setValues(3,0,data)
        time.sleep(1)

def run_server():
    slave_context = ModbusSlaveContext(hr=ModbusSequentialDataBlock(0, [0]*2))
    slaves = {}
    for i in range(1,2):
        slaves[i] = slave_context
    context = ModbusServerContext(slaves=slaves, single=False)

    identity = ModbusDeviceIdentification()
    identity.VendorName = 'Pymodbus'
    identity.ProductCode = 'PM'
    identity.VendorUrl = '<http://github.com/riptideio/pymodbus/'>
    identity.ProductName = 'Pymodbus Server'
    identity.ModelName = 'Pymodbus Server'
    identity.MajorMinorRevision = '1.5'

    t1 = Thread(target=data_change,args=("thread-1",slave_context))
    t1.start()
    StartTcpServer(context=context, identity=identity, address=("0.0.0.0", 502))
    t1.join()

if name == "main":
    run_server()
Prior to running this code, ensure that you have installed the pymodbus module by executing the following command:
$ pip install pymodbus
In the directory where you put the simulated python program file, start the pymodbus simulator with following command:
$ sudo python3 simu.py
Neuron Setup Guideline
By creating a southbound device node, Neuron can gain access to various devices, for example, a Modbus simulator in the demo.
By creating a northbound application node, Neuron establishes a connection with the MQTT broker, for example, EMQX, and uploads collected device data to EMQX.
Step 1: Start the browser and enter the URL https://hostname:7000/
Log in with the username “admin” and password “0000”
Step 2: Add a Southbound Device
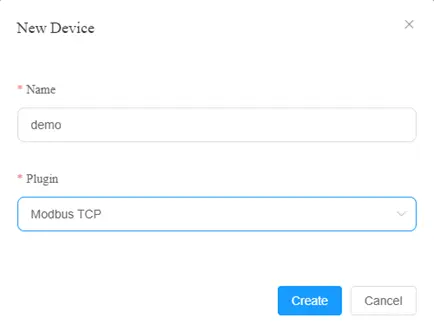
In the configuration menu, select South Devices to enter the South Devices interface. Click Add Device to add a new device.

Fill in the name of the device, and select the plugin Modbus TCP from the drop-down box, and then click on the “Create” button.
Step 3: Set parameters for southbound devices
After adding a southbound device, fill in the following parameters and submit, and then click on the “Submit” button.
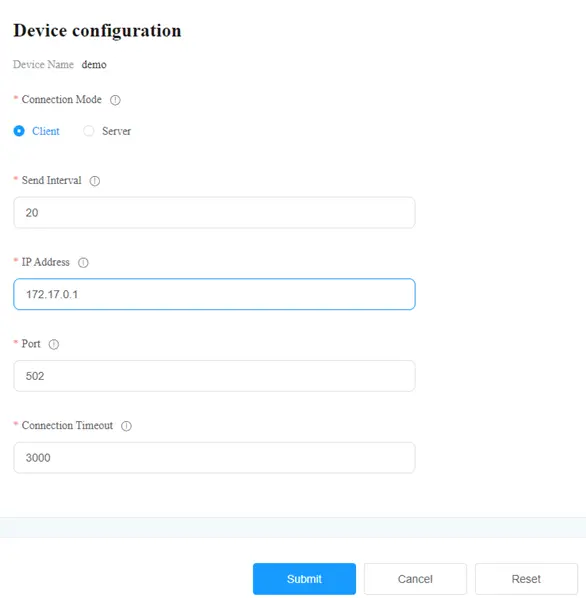
Note: Enter the IP address 172.17.0.1 for Docker virtual network.
Step 4: Create a group in the device card
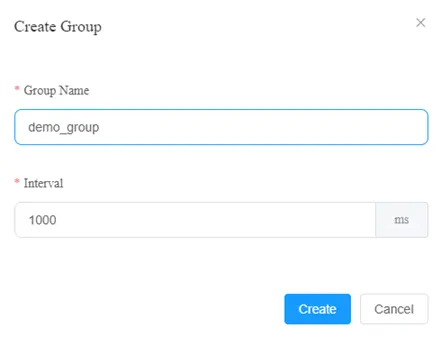
Click on the name “demo” of the device, it shows an empty group list. Click on the “Create” button to fill in the group name and interval in dialog box, and then click on the “Create” button.
Step 5: Add tags to the group.
Click on the name “demo_group” of group, and enter into the tag list page. Click on the “Create” button to create tag points. Fill the first row of tag point with name “temperature” and then second row of tag point with name “humidity”.
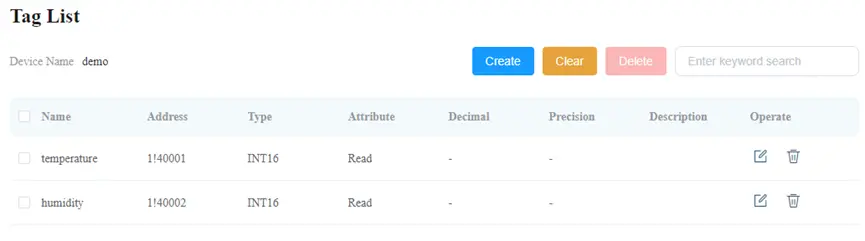
Tag addresses for temperature and humidity would be 1!40001 and 1!40002 respectively, where 1 is station number, 40001 and 40002 are temperature register and humidity register respectively.
Step 6: Check over the collected data in Data Monitoring Menu.
Select Monitoring → Data Monitoring from the left navigation menu. Select “demo” in South Device Box and demo_group in Group Name Box. The values of temperature and humidity would be shown as following:
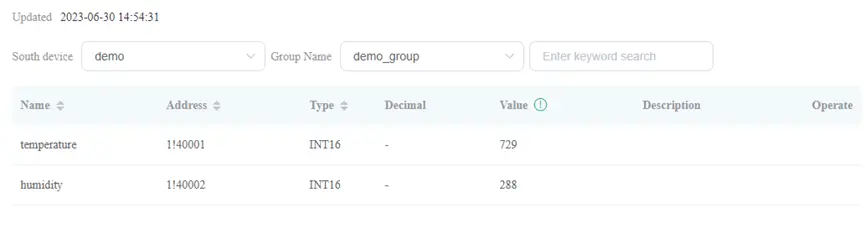
Note: At this moment, Neuron is successfully connected to Python Simulator Program. The Value will be varied in around 280 and 700.
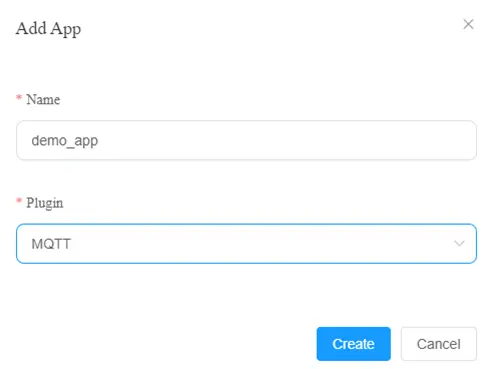
Step 7: Add northbound plugin modules to the application.
Select Configuration → North Apps from the left navigation menu. Click on the “Add Application” button. Fill the application name “demo_app” and MQTT plugin as shown following:
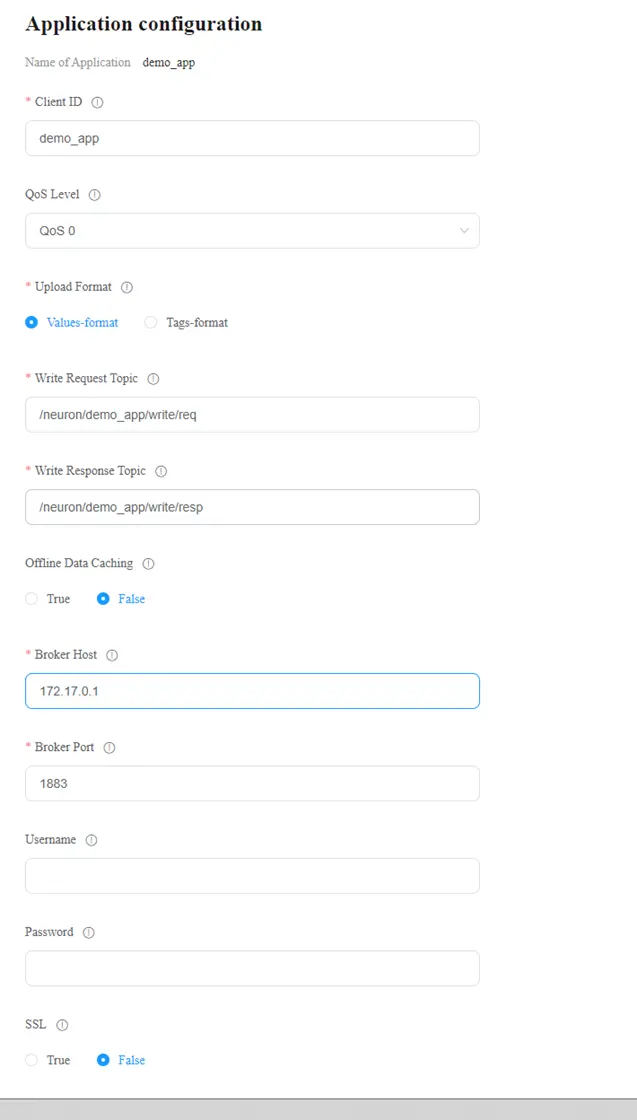
Step 8: Configure northbound application parameters.
An MQTT application parameter list would be shown. Fill the Broker Host with docker virtual IP address “172.17.0.1”. Other parameters left unchanged. After finished, click on the button “Submit” to submit the parameters.
Step 9: Subscribe to the Southbound Point Group
Click on the name “demo_app”, enter into Group List Subscription Page. Click on the button “Add Subscription”. Select the demo in South Device Box and demo_group in Group Box. Use default Topic as shown, and then click on the “Submit” button.

Step 10: Check out the MQTT connection with MQTTX.
Start the MQTTX on Windows platform. Click on the “New Connection” on the main page. Fill in the configuration parameters, and click “Connect” in the upper right corner.
Click Add Subscription, and the topic should be the same as the one in step 9. For example, fill in “/neuron/demo_app/demo/demo_group”. After a successful subscription, you can see that MQTTX continues to receive data collected and reported by Neuron. As shown in the following figure.
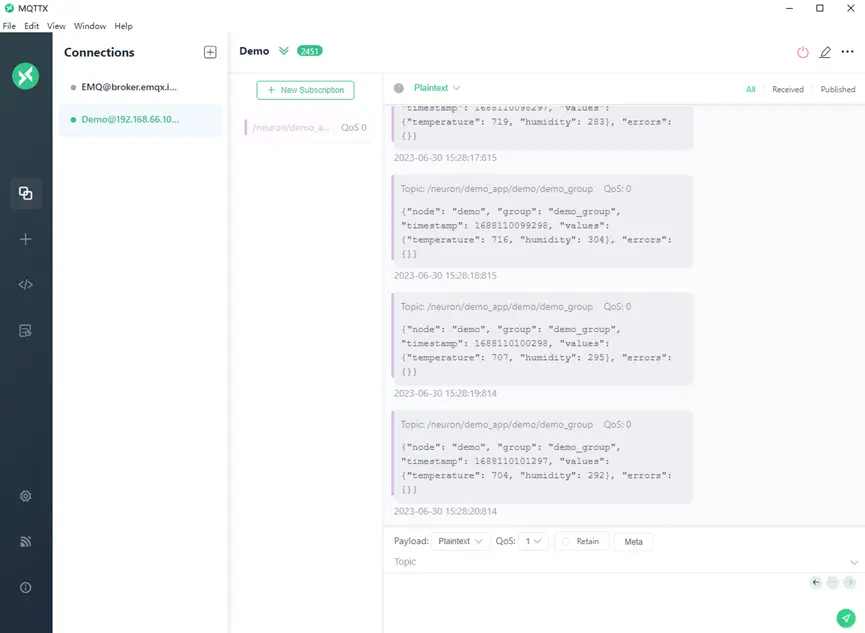
When MQTTX display the messages subscribed from EMQX broker continuously, it represents Neuron has successfully published the device data messages to EMQX broker continuously.
Note: Here we use MQTTX, a powerful cross-platform MQTT client tool, which can be downloaded from the official website: https://mqttx.app/downloads.
Timescale Database Setup Procedure
A database and a table must be created in Timescale database before EMQX broker ingest data to that database.
Step 1: Setup timescale database by executing the psql command line tool with docker.
$ sudo docker exec -it timescaledb psql -U postgres
Step 2: Create database “demo” in timescale
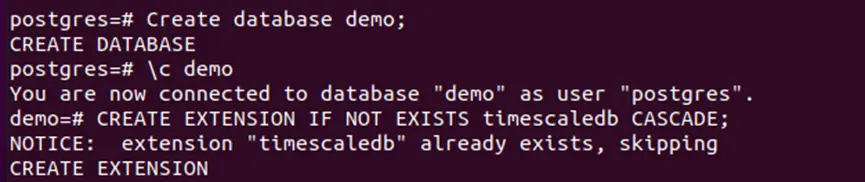
In the command prompt, type “Create database demo;” to create demo database. After successfully created, get connecting to database and create an extension as follows:
Step 3: Create table “conditions” in database “demo”
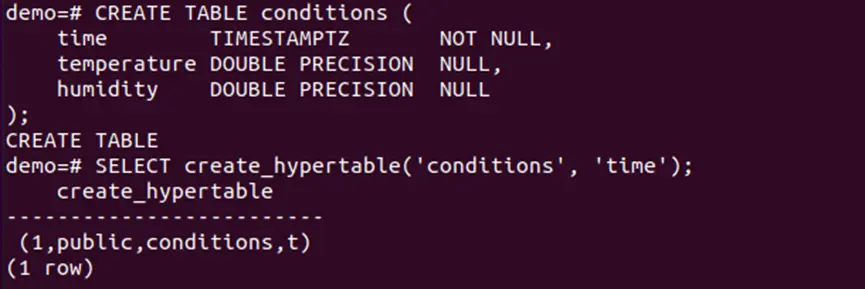
Now, a table “conditions” with fields “time”, “temperature” and “humidity” must be created as follows:
Step 4: Check the table “conditions”
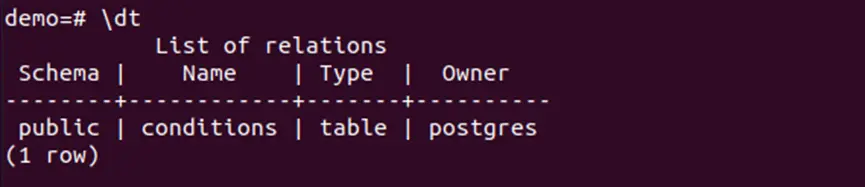
Lastly, simply check the “conditions” table by using the command “\dt” as follows:
EMQX Setup for Ingesting Data into Timescale Database
After finishing the database creation process, EMQX can be able to connect to Timescale database now. Follow the steps to setup the necessary parameters and SQL statements.
Step 1: Start the browser and enter the URL http://hostname:18083/
Log in with the username “admin” and password “public”.
Note: System will ask you to change password for the first time login.
Step 2: Create a rule for ingesting data to timescale in Rule Engine.
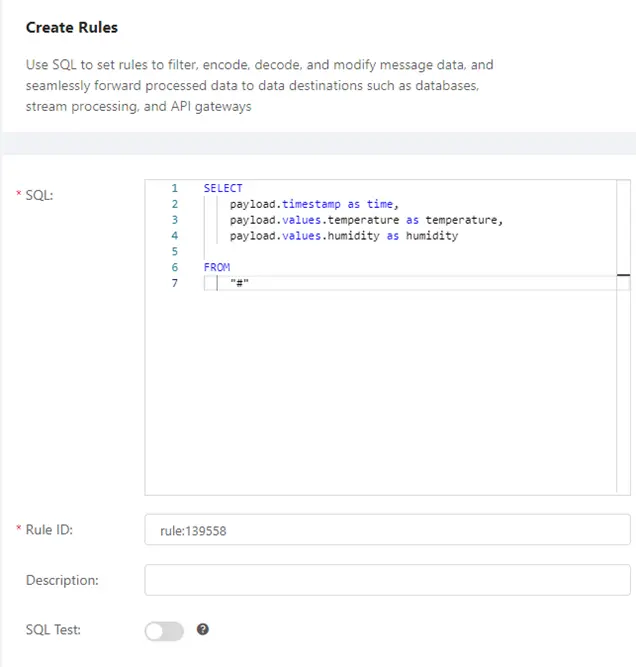
In EMQX Dashboard, select the "Rules" tab on the left menu bar. Click on the button “Create” to create the rule in SQL box as following:
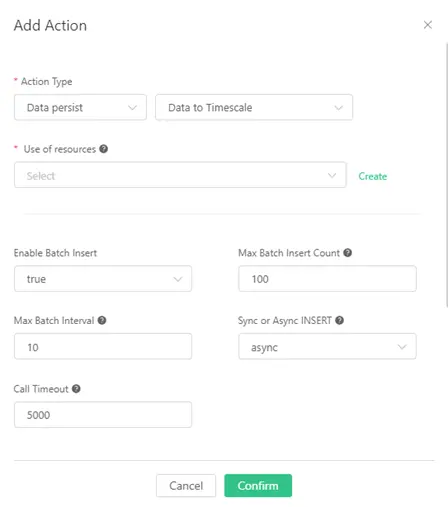
Step 3: Add action for the rule
The rule would trigger the action when SQL is successfully executed. Click on the “Add action” button at the bottom of Rule Engine. Select “Data persist” and Data to Timescale” in Action Type.
Step 4: Add Resource in the Rule Action
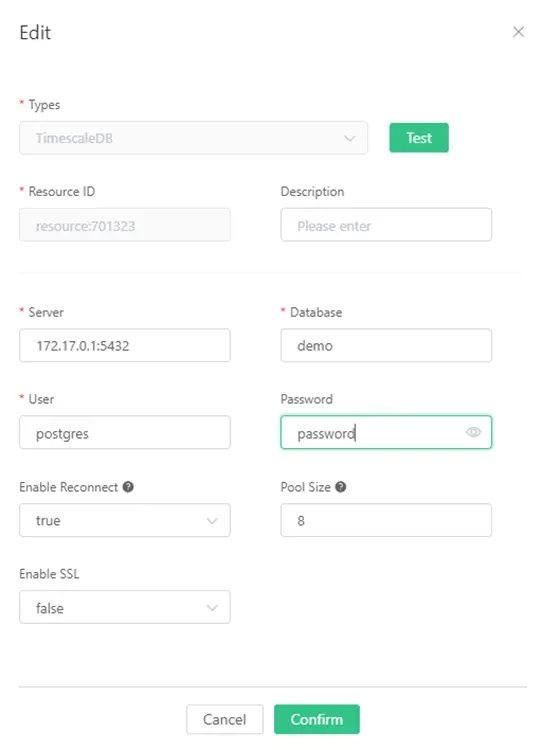
Click on the “Create” link near to “Use of resources” in the above Action Screen. A Resource screen will be displayed as follows. Fill in Server IP “172.17.0.1”, Database “demo”, User “postgres”, Password “password” as following, and click on the button “Confirm” to go back to Create Rules Screen.
Step 5: Add SQL statements to ingest data
Lastly, fill in the SQL template. In this example, we insert a piece of data into Timescale, and the SQL template is as follows, and click on the “Confirm” button after finishing the inputs.
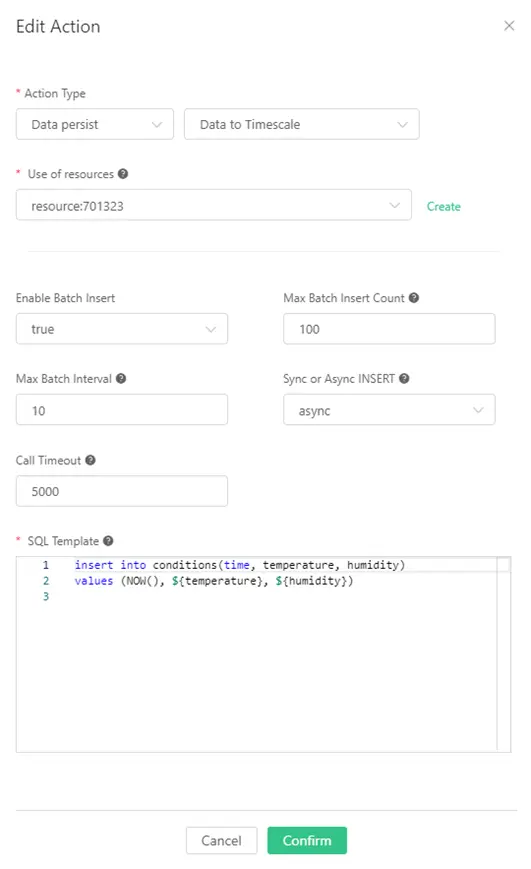
Note: Before inserting data, the ${temperature} and ${humidity} placeholder in the SQL template will be replaced with the corresponding value.
Step 6: Check out the data in Timescale database.
Enter the below SELECT statement in database demo. There should be some rows of data already. Now, the temperature and humidity data have been successfully saved in Timescale database.

Grafana Setup for Retrieving Data from Timescale Database
Grafana application would be set up for connecting to Timescale database in order to provide a visualization for temperature and humidity readings. Follow the steps to set up the visualization.
Step 1: Start the browser and enter the URL http://hostname:3000
Log in with the username “admin” and password “admin”.
Note: New password is required for the first-time login.
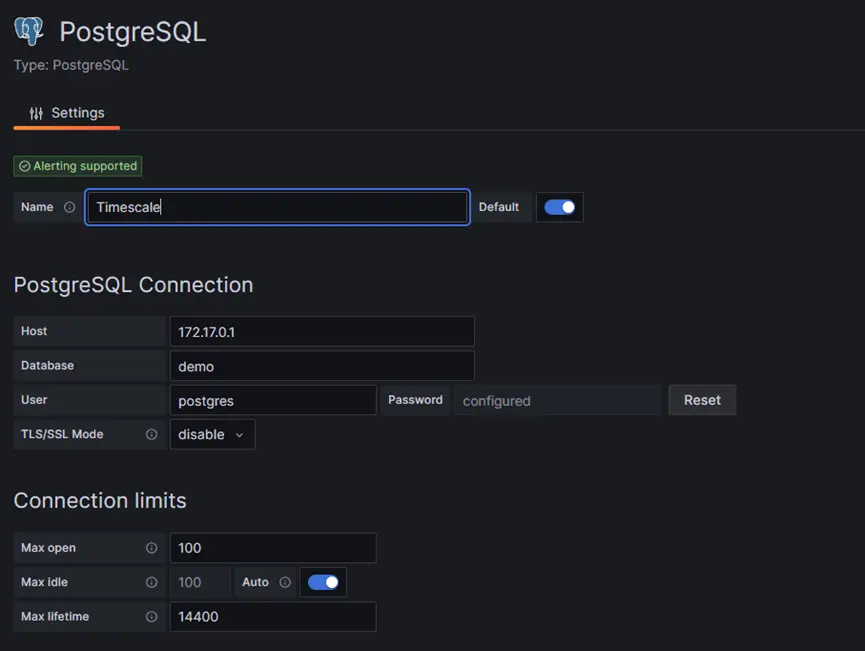
Step 2: Setup the data sources
Select PostgreSQL data source from Data Source Page. Enter the Host, Database, User and Password for Timescale database connection.
At the end of page, it should be seen
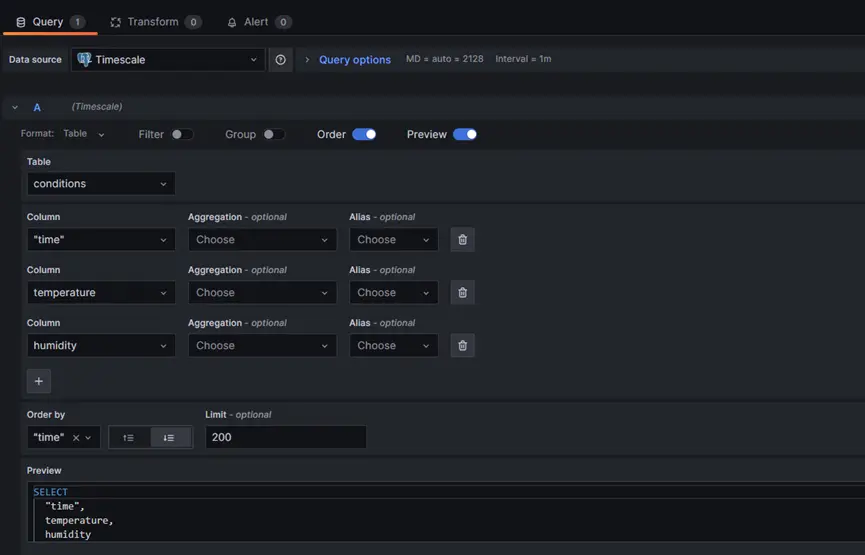
Step 3: Add visualization
Select the data source “Timescale” from the list. Construct the SQL Query as follows. Fill the Columns with “time”, “temperature” and “humidity” and in descending order. Click on the “Save” button at the top right conner to save the visualization.
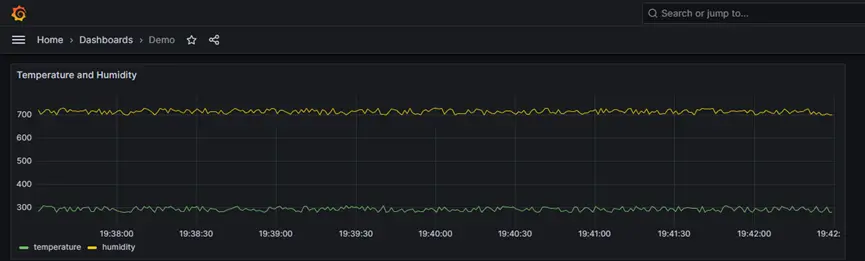
Step 4: View the chart on visualization
Now, the temperature and humidity data have been viewed in visualization chart. That is all for this demo setup.
Rich IT and OT Connectivity
The demo above provides an illustration of a simple Modbus connection and access to a Timescale database. However, it's important to note that both Neuron and EMQX offer a wide range of drivers and connectors to meet diverse OT and IT connectivity requirements. These extensive OT and IT capabilities are essential for the development of a successful IIoT system. This can bridge IT and OT technologies together into the IIoT system.
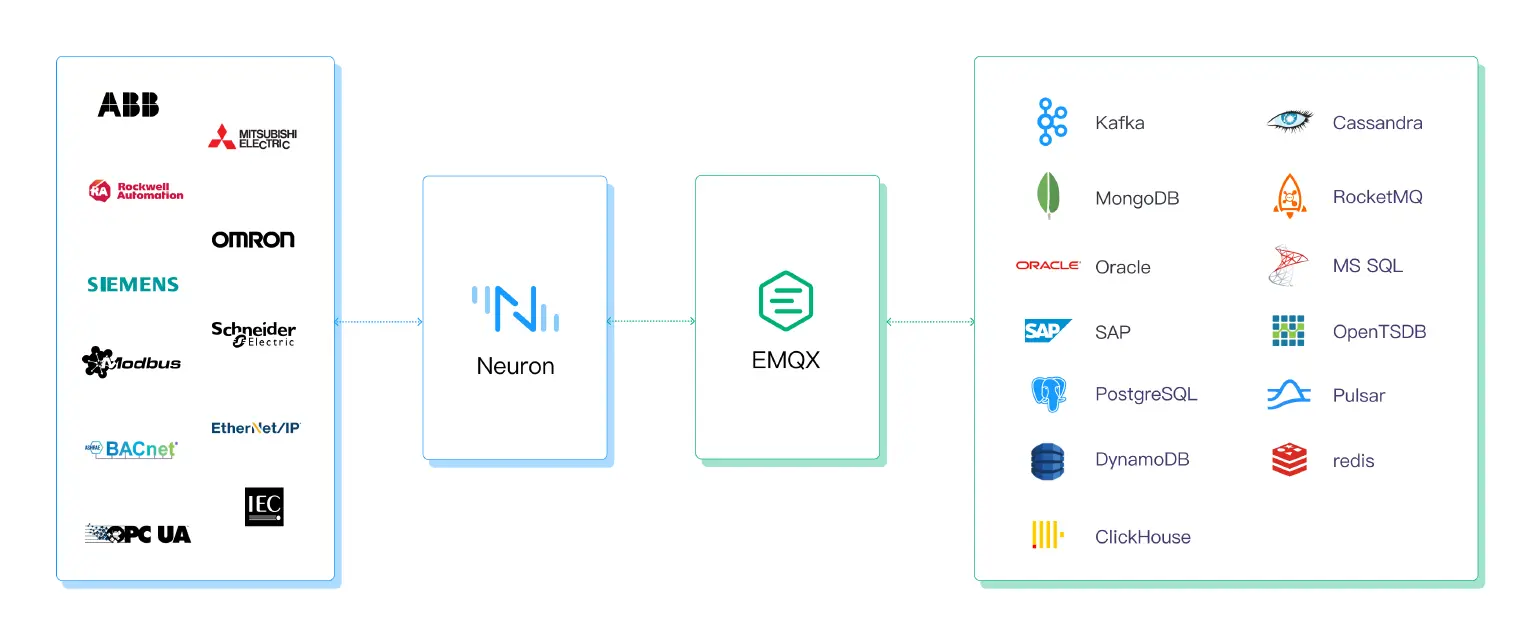
Seamless IT Connectivity
EMQX broker offers a wide range of data bridges, facilitating seamless integration with over 40 cloud services and enterprise systems. This enables instant access to data across diverse applications, reducing the cost and complexity of custom bridge development. EMQX supports integration with popular databases like MySQL, PostgreSQL, MongoDB, and more, as well as technologies like Redis, Oracle, SAP, and Kafka. This rich set of connectors ensures efficient IT connectivity and data exchange within the IIoT ecosystem.
Diverse OT Connectivity
Neuron serves as a protocol gateway, providing a comprehensive set of industrial connectivity options essential for successful IIoT deployments. With support for over 30 industrial protocols such as Modbus, Ethernet/IP, Profinet I/O, OPC-UA, IEC104, BACnet, and more, Neuron enables seamless communication with various devices and systems across the operational technology (OT) landscape. Whether it's PLCs, building automation systems, CNC machines, or robotics, Neuron offers a powerful range of drivers to ensure reliable OT connectivity and data acquisition.
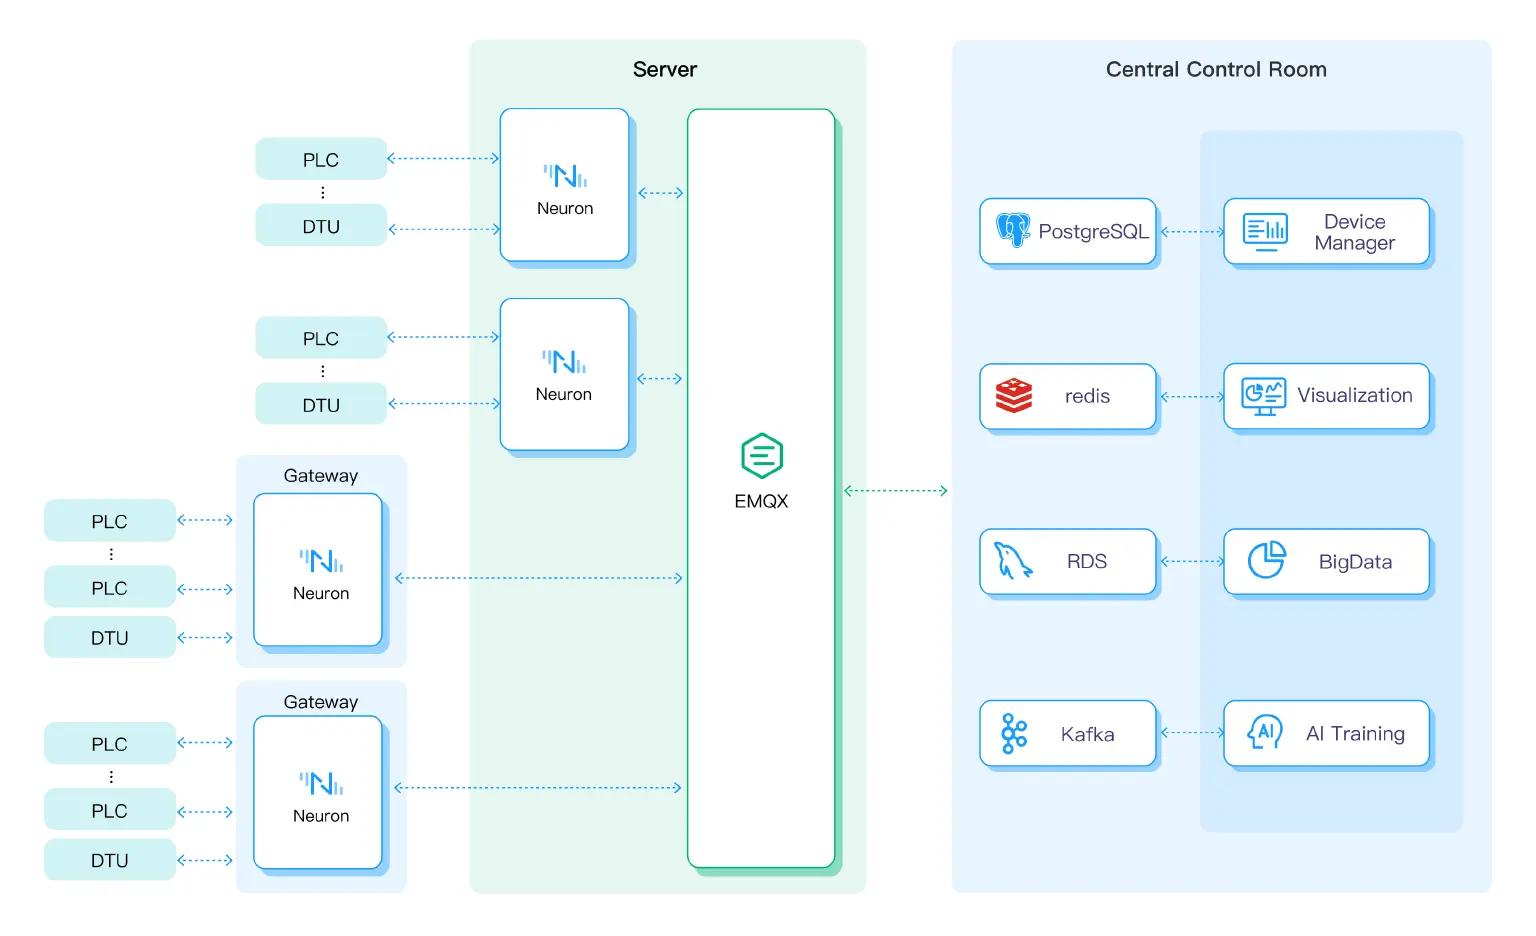
Efficient and Scalable IIoT Infrastructure
The above example presents a basic linear topology to demonstrate the IIoT infrastructure. In addition, EMQX and Neuron offer remarkable flexibility and scalability in developing complex IIoT solutions. For instance, multiple Neuron devices can be deployed in different locations to facilitate data acquisition. Some of these devices can be installed on a server alongside the EMQX broker, while others may be situated in remote gateway devices. On the other side, there is a central control room where other storage and analytic applications are consuming the data acquired from Neuron.
In large enterprises, multiple production locations serve different purposes, some organized vertically and others horizontally. EMQX clusters offer the capability to replicate messages across these production sites, enabling seamless data sharing throughout the enterprise. With high-speed replication, EMQX ensures that data received by one cluster is synchronized with other clusters in real-time or near-real-time, fostering efficient and timely data exchange across multiple production locations as shown in below diagram.
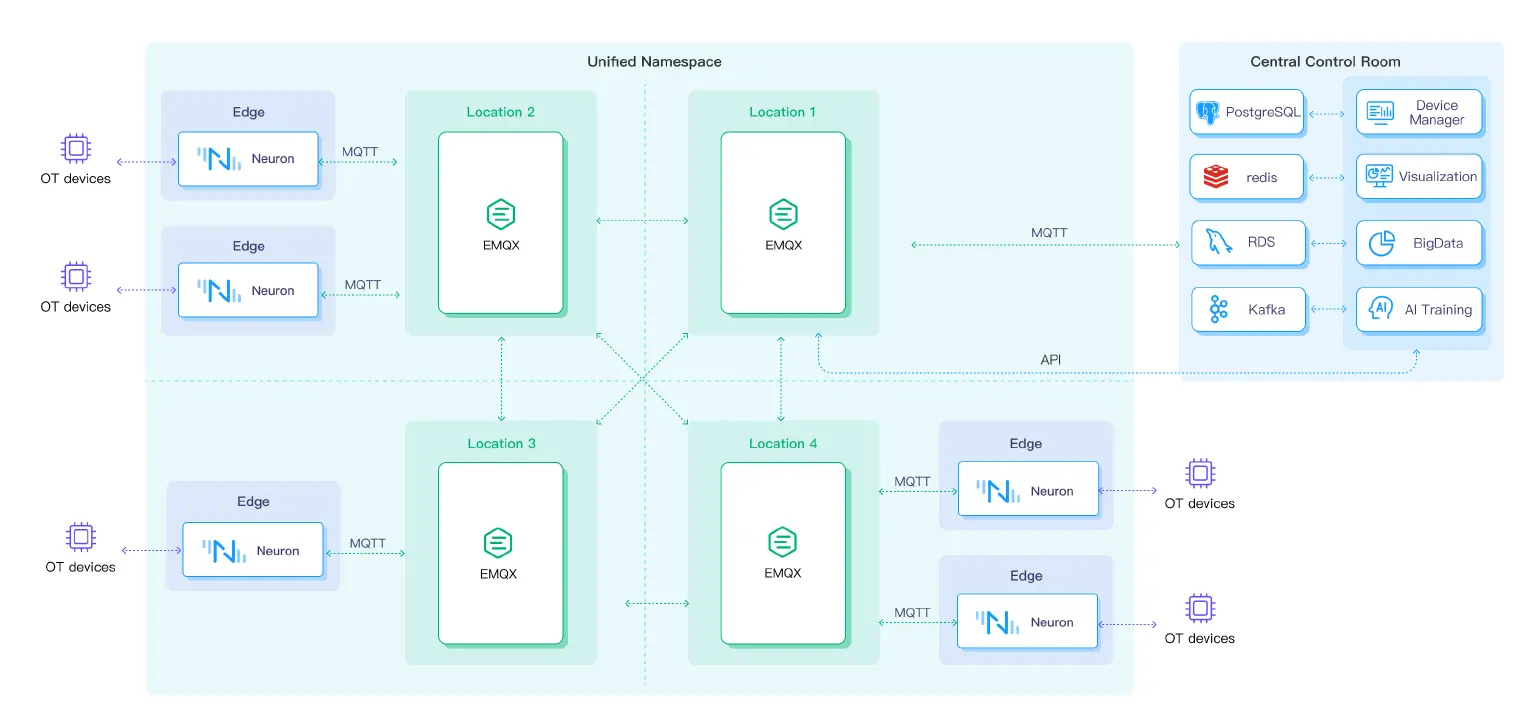
EMQX and Neuron together provide a unified namespace for Industrial IoT applications. A unified namespace is a common naming hierarchy for MQTT topics that enables devices and applications to communicate with each other, regardless of their original naming, location, or protocol. All data messages are well organized in a contextualized structure to form a unified namespace, providing the following benefits to your enterprise:
- Simplified Data Access: A unified namespace provides a consistent and standardized way to access data across multiple production locations. It eliminates the need for employees or systems to navigate through different directories or file structures on various locations, making data access more efficient and user-friendly.
- Improved Collaboration: With a unified namespace, employees and systems from different production locations can easily share and collaborate on production data. They can access and edit data in real-time, reducing communication barriers and streamlining collaborative workflows. This promotes cross-location teamwork and enhances productivity.
- Enhanced Data Management: A unified namespace enables centralized data management, allowing organizations to implement uniform data policies and governance across all production locations. It facilitates data backup, recovery, and security measures, ensuring consistent data protection practices throughout the enterprise.
- Simplified IT Administration: Managing a unified namespace is typically easier for IT administrators compared to maintaining separate operation domains for each production location. Centralized administration and control lead to streamlined operations, simplified user management, and reduced maintenance efforts.
- Scalability and Flexibility: A unified namespace provides scalability and flexibility as the enterprise expands or evolves. It allows for seamless integration of new production locations into the existing infrastructure, without significant modifications or disruptions. This scalability facilitates business growth and adaptability to changing market dynamics.
- Consistent User Experience: With a unified namespace, employees across different production locations experience a consistent user interface and workflow. This uniformity enhances user experience, reduces learning curves, and boosts overall user satisfaction, leading to increased efficiency and productivity.
- Improved Data Integrity: Contextualized data can improve the quality of data used in AI/ML models. By providing additional context and metadata, AI/ML models can better understand and interpret data, reducing errors and improving accuracy.
- AI/ML Precise Prediction: Contextualized data also enhance the predictive capabilities of AI/ML models. By providing additional context, models can make more accurate predictions about future events or outcomes. It helps AI/ML systems reducing bias by considering factors that may influence outcomes.
Learn more about Unified Namespace: Unified Namespace (UNS): Next-Generation Data Fabric for IIoT | EMQ
High-Speed Data Exchange
EMQX is well-suited for large-scale industrial IoT deployments, capable of handling millions of concurrent connections and messages per second. It guarantees sub-millisecond latency in message delivery with soft real-time runtime.
High-Speed data exchange is very important as it can support stable and reliable data replication across different location clusters, while handling large numbers of connected devices and processing high volumes of sensor data in near real-time. This capability is valuable for applications that involve high message volumes, such as telemetry data collection, machine-to-machine communication, and large-scale event-driven systems.
Conclusion
In conclusion, the OMH is a prime example of how working together and being innovative can shape the future of Industrial IoT. The stack we showcase in this article presents a fresh option for constructing a reliable and effective IIoT infrastructure. Through the seamless integration of Neuron's industrial connectivity, EMQX's robust and scalable MQTT broker, Timescale's high-performance time-series database, and Grafana's intuitive visualization prowess, a new era of industrial system architecture is upon us.
As industries continue to navigate the complexities of the digital age, the OMH paves the way for efficiency, scalability, and real-time insights, fundamentally transforming the way we design, deploy, and manage IIoT systems. With a future marked by ever-expanding technological horizons, we believe the OHM will illuminate the path to a smarter, more connected industrial landscape.