Open MQTT Benchmarking Comparison: EMQX vs NanoMQ
The blog post Open MQTT Benchmark Suite: The Ultimate Guide to MQTT Performance Testing introduced the Open MQTT Benchmark Suite developed by EMQ. We defined MQTT benchmark scenarios, use cases, and observation metrics in the GitHub project. Based on the activity and popularity of the community and GitHub project, the top 4 open-source MQTT brokers in 2023 – EMQX, Mosquitto, NanoMQ, and Vernemq, were chosen to perform the benchmark test.
This blog series presents the benchmark test results and aims to help you choose a suitable MQTT broker based on your needs and use cases.
This is the second post of the blog series, which provides the benchmarking results of EMQX and NanoMQ. Additionally, we compare the features and capabilities of both brokers in detail in another post.
MQTT Benchmark Scenarios and Use Cases
The MQTT Benchmark Suite designs two sets of benchmark use cases. One is named Basic Set, which is for small-scale performance verification, and another is called Enterprise Set, which aims for enterprise level verification.
Detailed descriptions of the testing scenarios are already available on the GitHub project. For convenience, we briefly list them here as well.
All the tests are executed on a single node.
Use Cases
Basic Set
- Point-to-Point: p2p-1K-1K-1K-1K
- 1k publishers, 1k subscribers, 1k topics
- Each publisher pubs 1 message per second
- QoS 1, payload 16B
- Fan-out: fanout-1-1k-1-1K
- 1 publisher, 1 topic, 1000 subscribers
- 1 publisher pubs 1 message per second
- QoS 1, payload 16B
- Fan-in: sharedsub-1K-5-1K-1K
- 1k publishers, 1k pub topics
- 5 subscribers consume all messages in a shared subscription way
- Publish rate: 1k/s (each publisher pubs a message per second)
- Shared subscription’s topic: $share/perf/test/#
- Publish topics: test/$clientid
- QoS 1, payload 16B
- Concurrent connections: conn-tcp-10k-100
- 10k connections
- Connection rate (cps): 100/s
Enterprise Set
- point-to-point: p2p-50K-50K-50K-50K
- 50k publishers, 50k subscribers, 50k topics
- Each publisher pubs 1 message per second
- QoS 1, payload 16B
- Fan-out: fanout-5-1000-5-250K
- 5 publishers, 5 topics, 1000 subscribers (each sub to all topics)
- Publish rate: 250/s, so sub rate = 250*1000 = 250k/s
- QoS 1, payload 16B
- Fan-in: sharedsub-50K-500-50K-50K
- 50k publishers, 50k pub topics
- Publish rate: 50k/s (each publisher pubs a message per second)
- Use a shared subscription to consume data (to avoid slow consumption by subscribers affecting broker performance, 500 subscribers are used to share the subscription)
- Shared subscription’s topic: $share/perf/test/#
- Publish topics: test/$clientid
- QoS 1, payload 16B
- Concurrent connections: conn-tcp-1M-5K
- 1M connections
- Connection rate (cps): 5000/s
Common MQTT Config
| Config | Value |
|---|---|
| keep alive | 300s |
| clean session | true |
| authentication enablement | no |
| TLS authentication enablement | no |
| test duration | 30 minutes |
Testbed
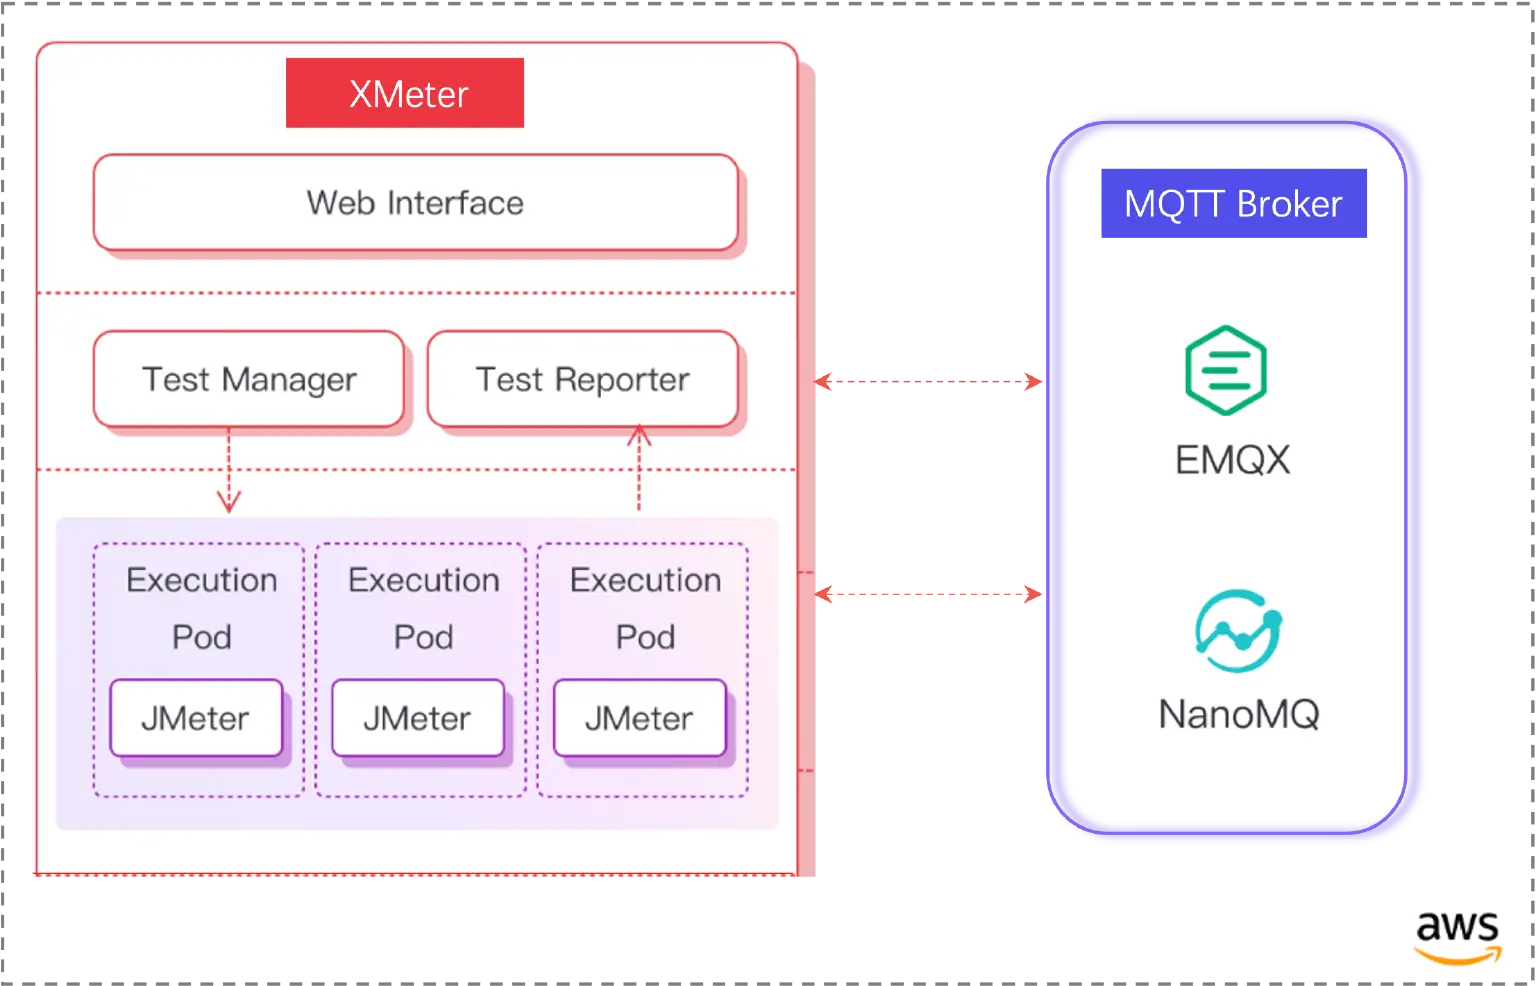
The test environment is configured on AWS, and all virtual machines are within a VPC (virtual private cloud) subnet.
Broker machine Details
- Public cloud: AWS
- Instance type: c5.4xlarge 16C32G
- OS: Ubuntu 22.04.1 amd64
Test Tool
XMeter is used in this benchmark test to simulate various business scenarios. XMeter is built on top of JMeter but with enhanced scalability and more capabilities. It provides comprehensive and real-time test reports during the test. Additionally, its built-in monitoring tools are used to track the resource usage of the EMQX/NanoMQ server, enabling a comparison with the information provided by the operating systems.
XMeter provides a private deployment version (on-premise) and a public cloud SaaS version. A private XMeter is deployed in the same VPC as the MQTT broker server in this testing.
SW Version
| Broker | Version |
|---|---|
| EMQX | 4.4.16 |
| NanoMQ | 0.17.0 |
| XMeter | 3.2.4 |
Benchmarking Results
Basic Set
point-to-point: 1K:1K
| Average pub-to-sub latency (ms) | Max CPU user+system | Avg CPU user+system | Max memory used | Avg memory used | |
|---|---|---|---|---|---|
| EMQX | 0.27 | 4% | 2% | 510M | 495M |
| NanoMQ | 0.25 | 1% | 0% | 271M | 270M |
Fan-out 1k QoS 1
| Average pub-to-sub latency (ms) | Max CPU user+system | Avg CPU user+system | Max memory used | Avg memory used | |
|---|---|---|---|---|---|
| EMQX | 3 | 2% | 1% | 475M | 460M |
| NanoMQ | 13.66 | 0% | 0% | 271M | 263M |
Fan-in 1k - shared subscription QoS 1
| Average pub-to-sub latency (ms) | Max CPU user+system | Avg CPU user+system | Max memory used | Avg memory used | |
|---|---|---|---|---|---|
| EMQX | 0.19 | 3% | 2% | 468M | 460M |
| NanoMQ | 0.18 | 0% | 0% | 294M | 267M |
10K connections cps 100
| Average latency (ms) | Max CPU user+system | Avg CPU user+system | Max memory used | Memory used Stable at | |
|---|---|---|---|---|---|
| EMQX | 0.74 | 2% | 1% | 540M | 510M |
| NanoMQ | 0.59 | 0% | 0% | 320M | 320M |
Enterprise Set
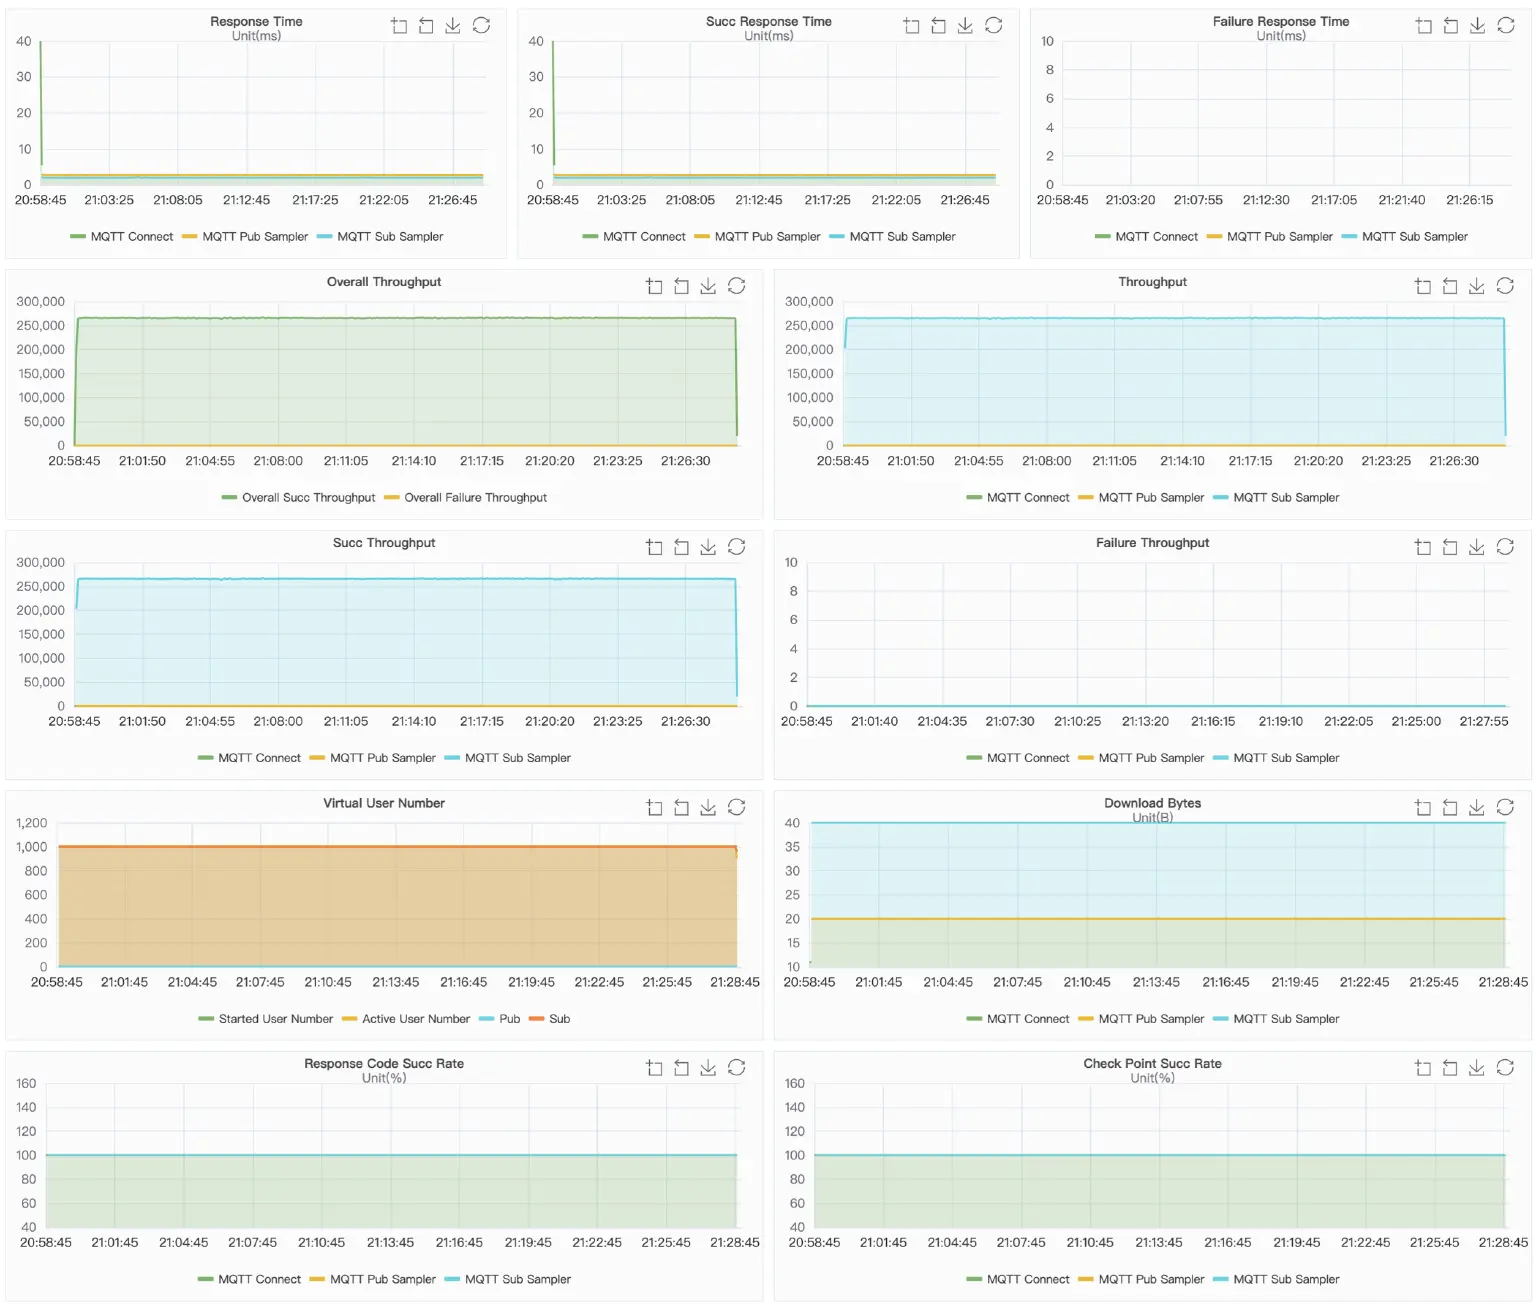
point-to-point: p2p-50K-50K-50K-50K
Metrics
| Actual msg rate | Average pub-to-sub latency (ms) | Max CPU user+system | Avg CPU user+system | Max memory used | Avg memory used | |
|---|---|---|---|---|---|---|
| EMQX | 50k:50k | 1.58 | 88% | 80% | 5.71G | 5.02G |
| NanoMQ | 50k:50k | 91 | 35% | 30% | 1.33G | 1.3G |
pub-to-sub latency percentiles
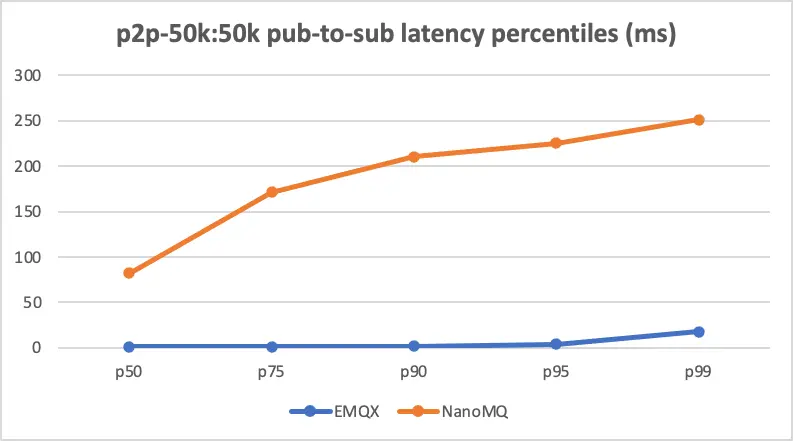
| Latency (ms) | EMQX | NanoMQ |
|---|---|---|
| p50 | 1 | 82 |
| p75 | 1 | 171 |
| p90 | 2 | 210 |
| p95 | 4 | 225 |
| p99 | 18 | 251 |
Result Charts
- EMQX
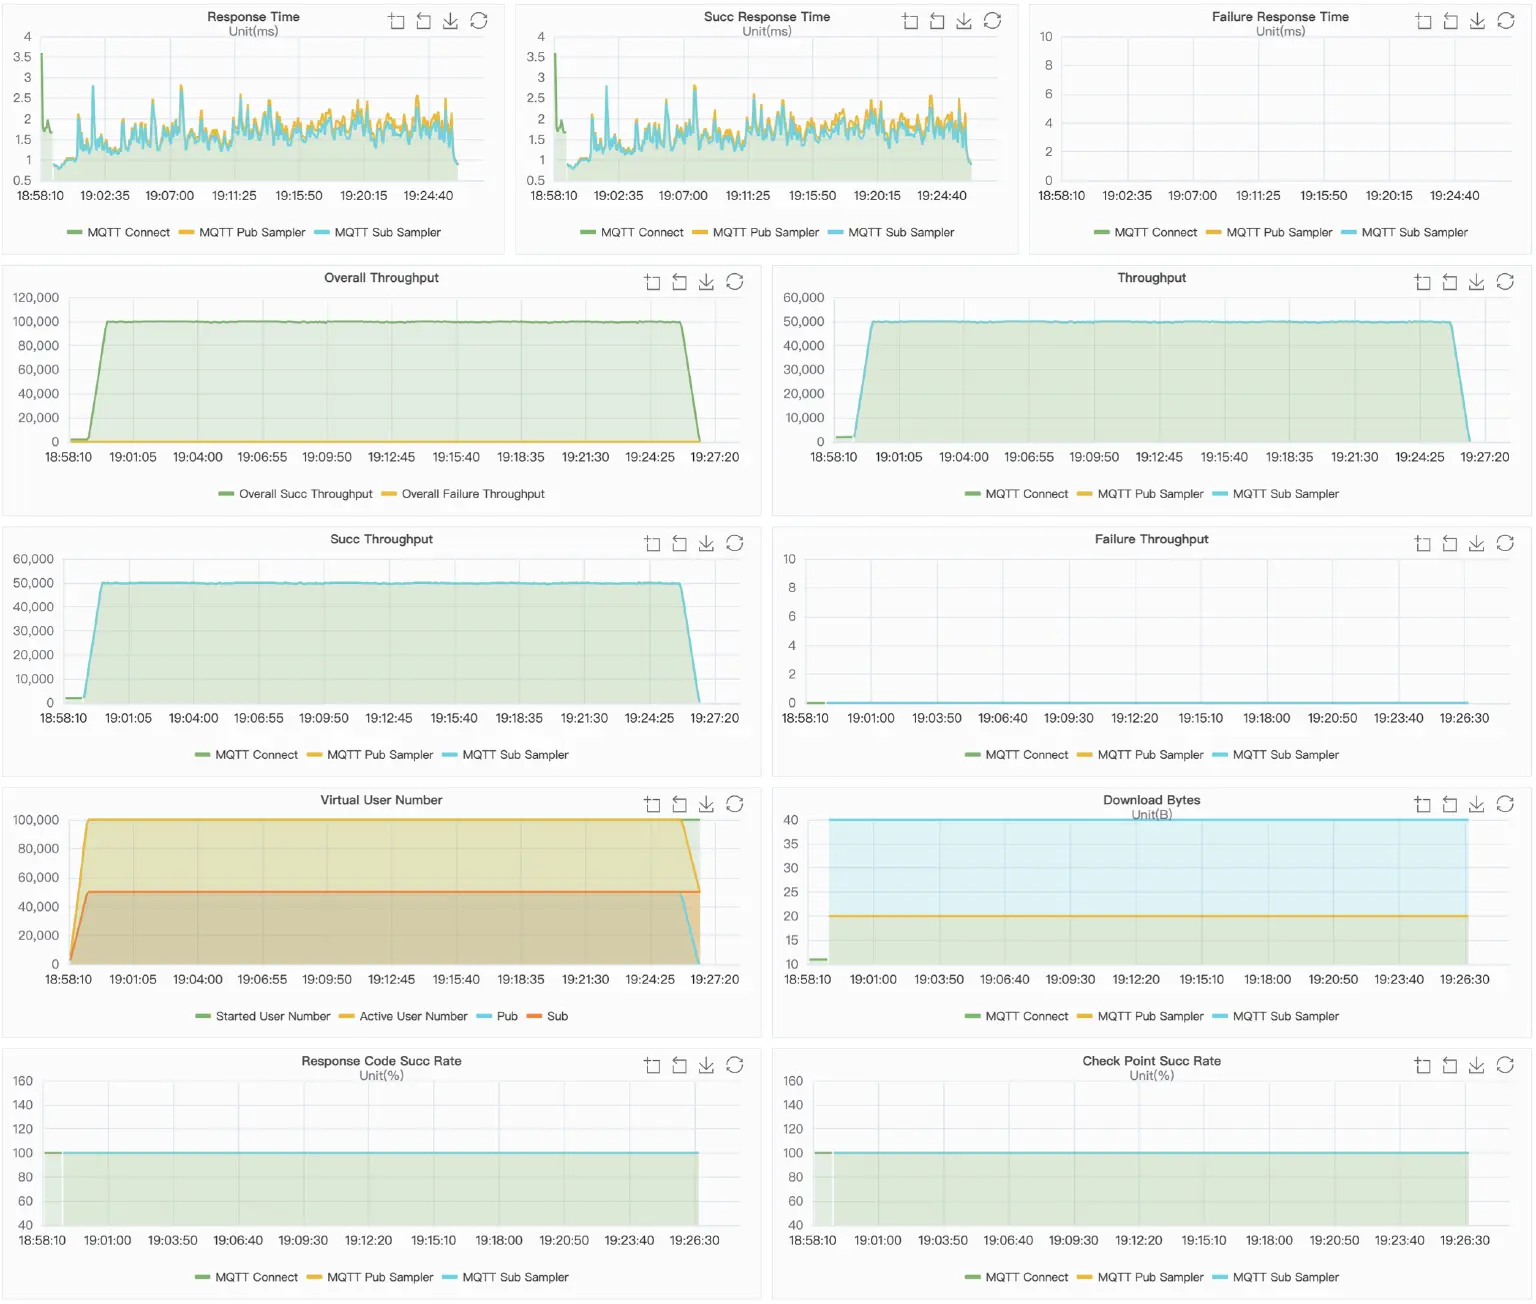
- NanoMQ
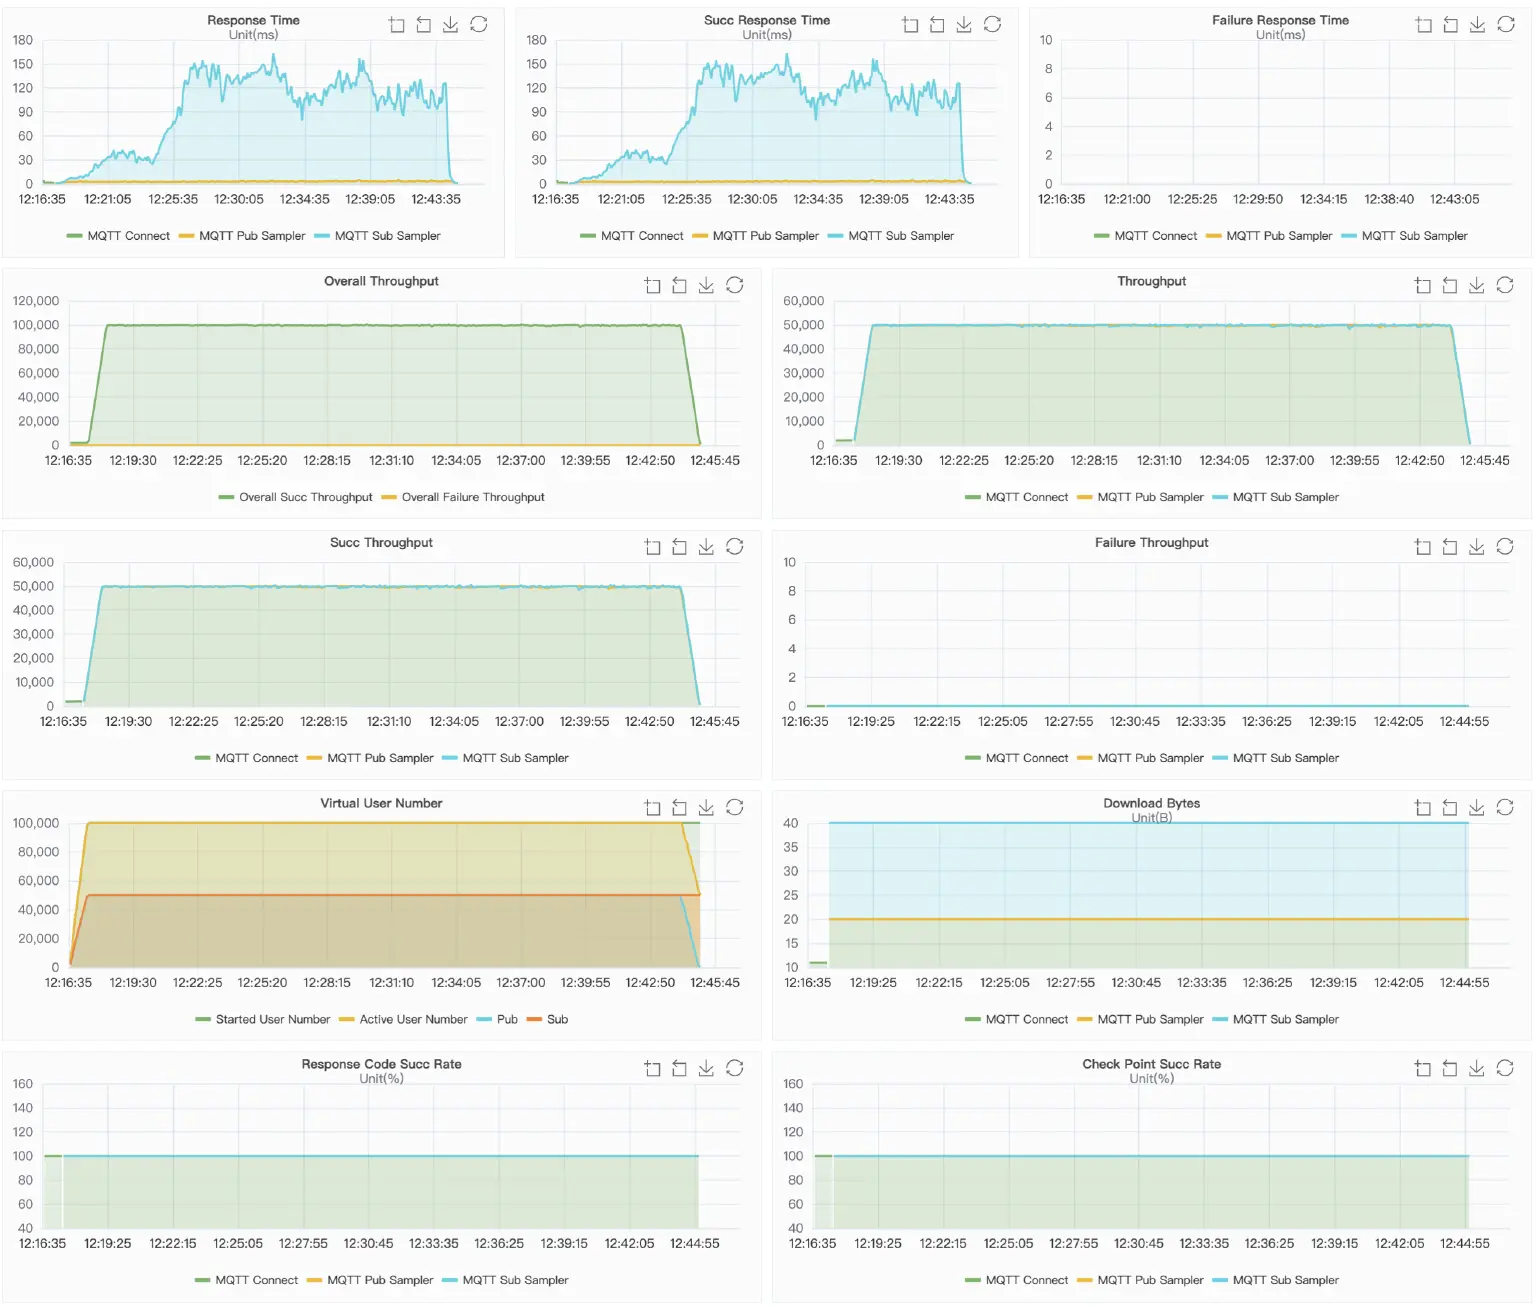
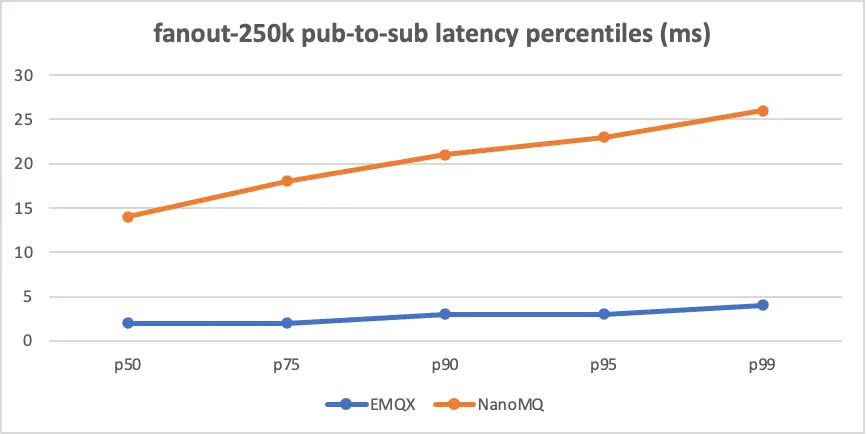
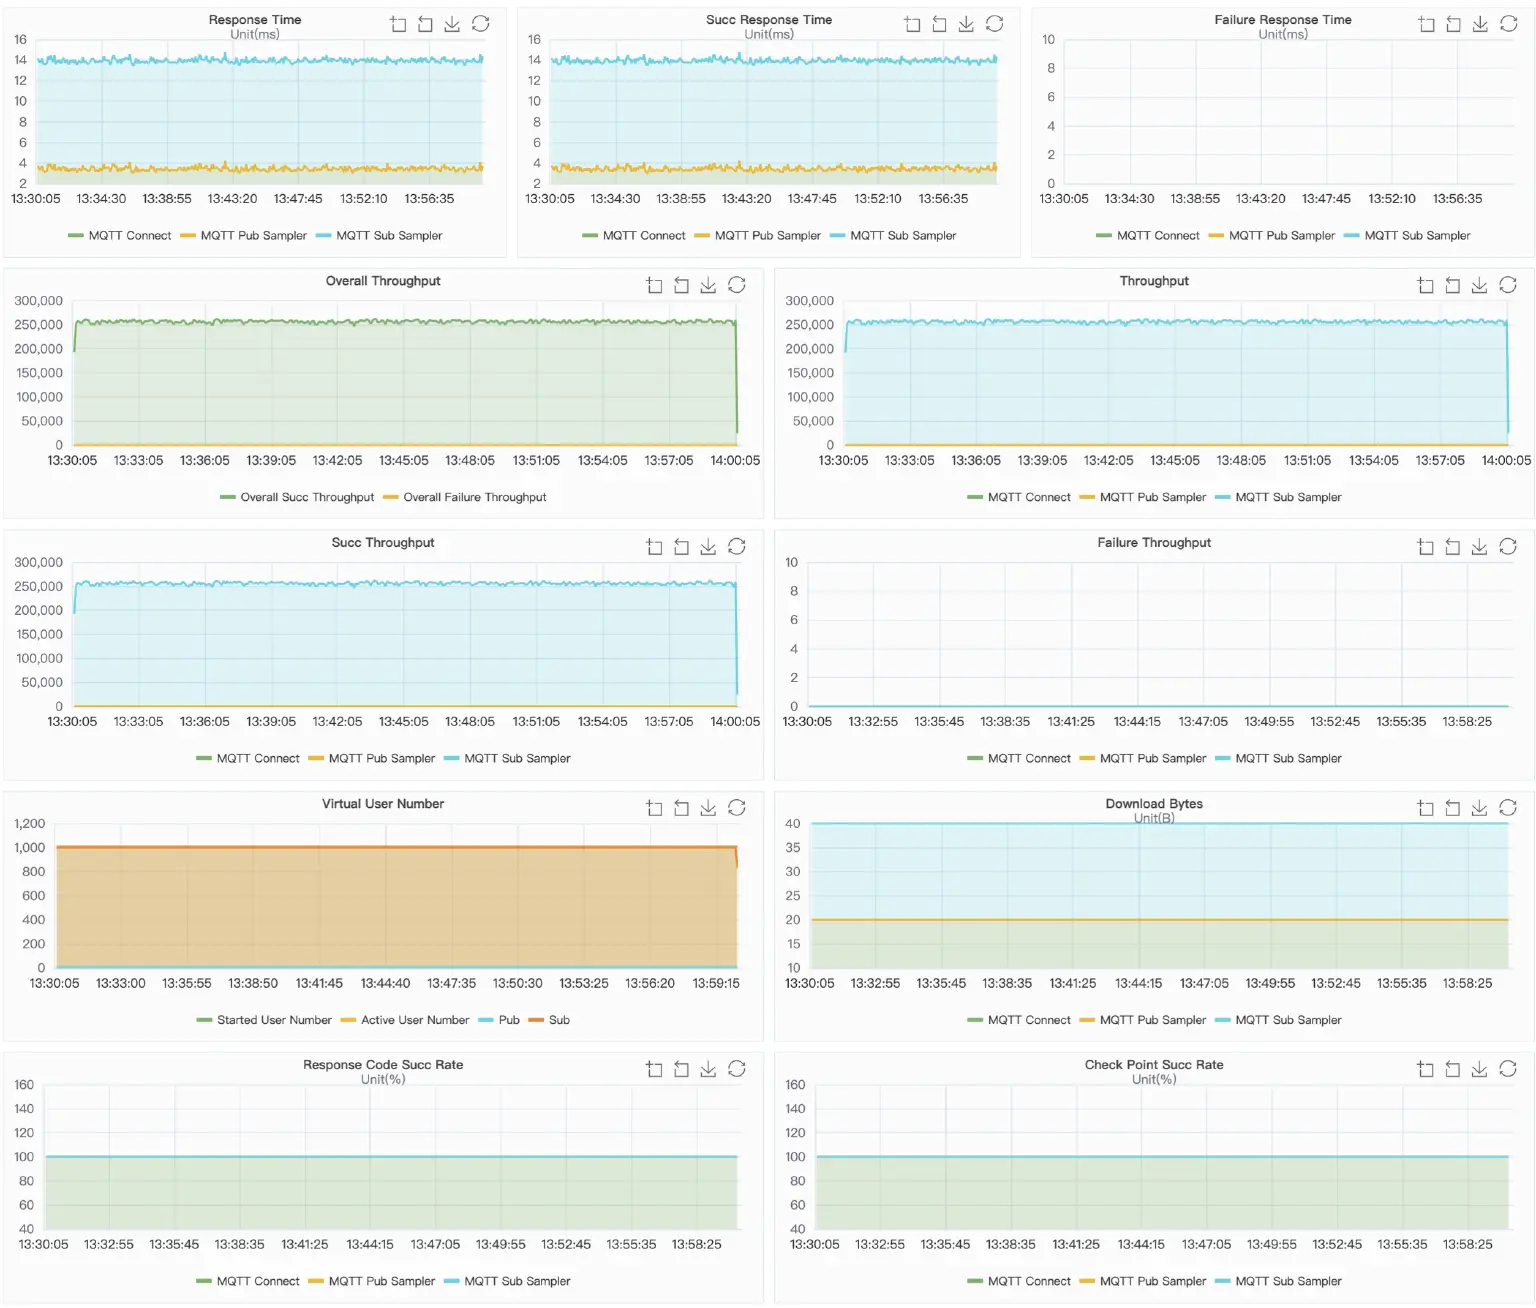
Fan-out: fanout-5-1000-5-250K
Metrics
| Actual msg rate | Average pub-to-sub latency (ms) | Max CPU user+system | Avg CPU user+system | Max memory used | Avg memory used | |
|---|---|---|---|---|---|---|
| EMQX | 250k | 1.99 | 73% | 71% | 530M | 483M |
| NanoMQ | 255k | 13.91 | 73% | 71% | 781M | 682M |
pub-to-sub latency percentiles
| Latency (ms) | EMQX | NanoMQ |
|---|---|---|
| p50 | 2 | 14 |
| p75 | 2 | 18 |
| p90 | 3 | 21 |
| p95 | 3 | 23 |
| p99 | 4 | 26 |
Result Charts
- EMQX
- NanoMQ
Fan-in: sharedsub-50K-500-50K-50K
Metrics
| Actual msg rate | Average pub-to-sub latency (ms) | Max CPU user+system | Avg CPU user+system | Max memory used | Avg memory used | |
|---|---|---|---|---|---|---|
| EMQX | pub: 50k sub: 50k | 1.47 | 94% | 93% | 8.19G | 6.67G |
| NanoMQ | pub: 50k sub: 50k | 2.76 | 34% | 34% | 795M | 783M |
pub-to-sub latency percentiles
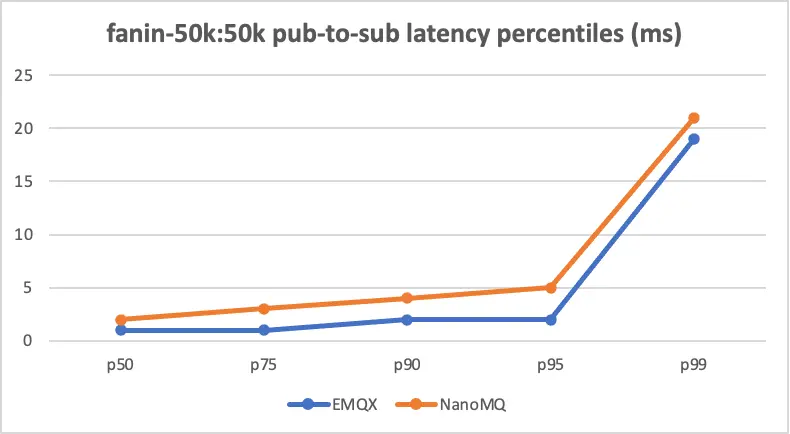
| Latency (ms) | EMQX | NanoMQ |
|---|---|---|
| p50 | 1 | 2 |
| p75 | 1 | 3 |
| p90 | 2 | 4 |
| p95 | 2 | 5 |
| p99 | 19 | 21 |
Result Charts
- EMQX
- NanoMQ
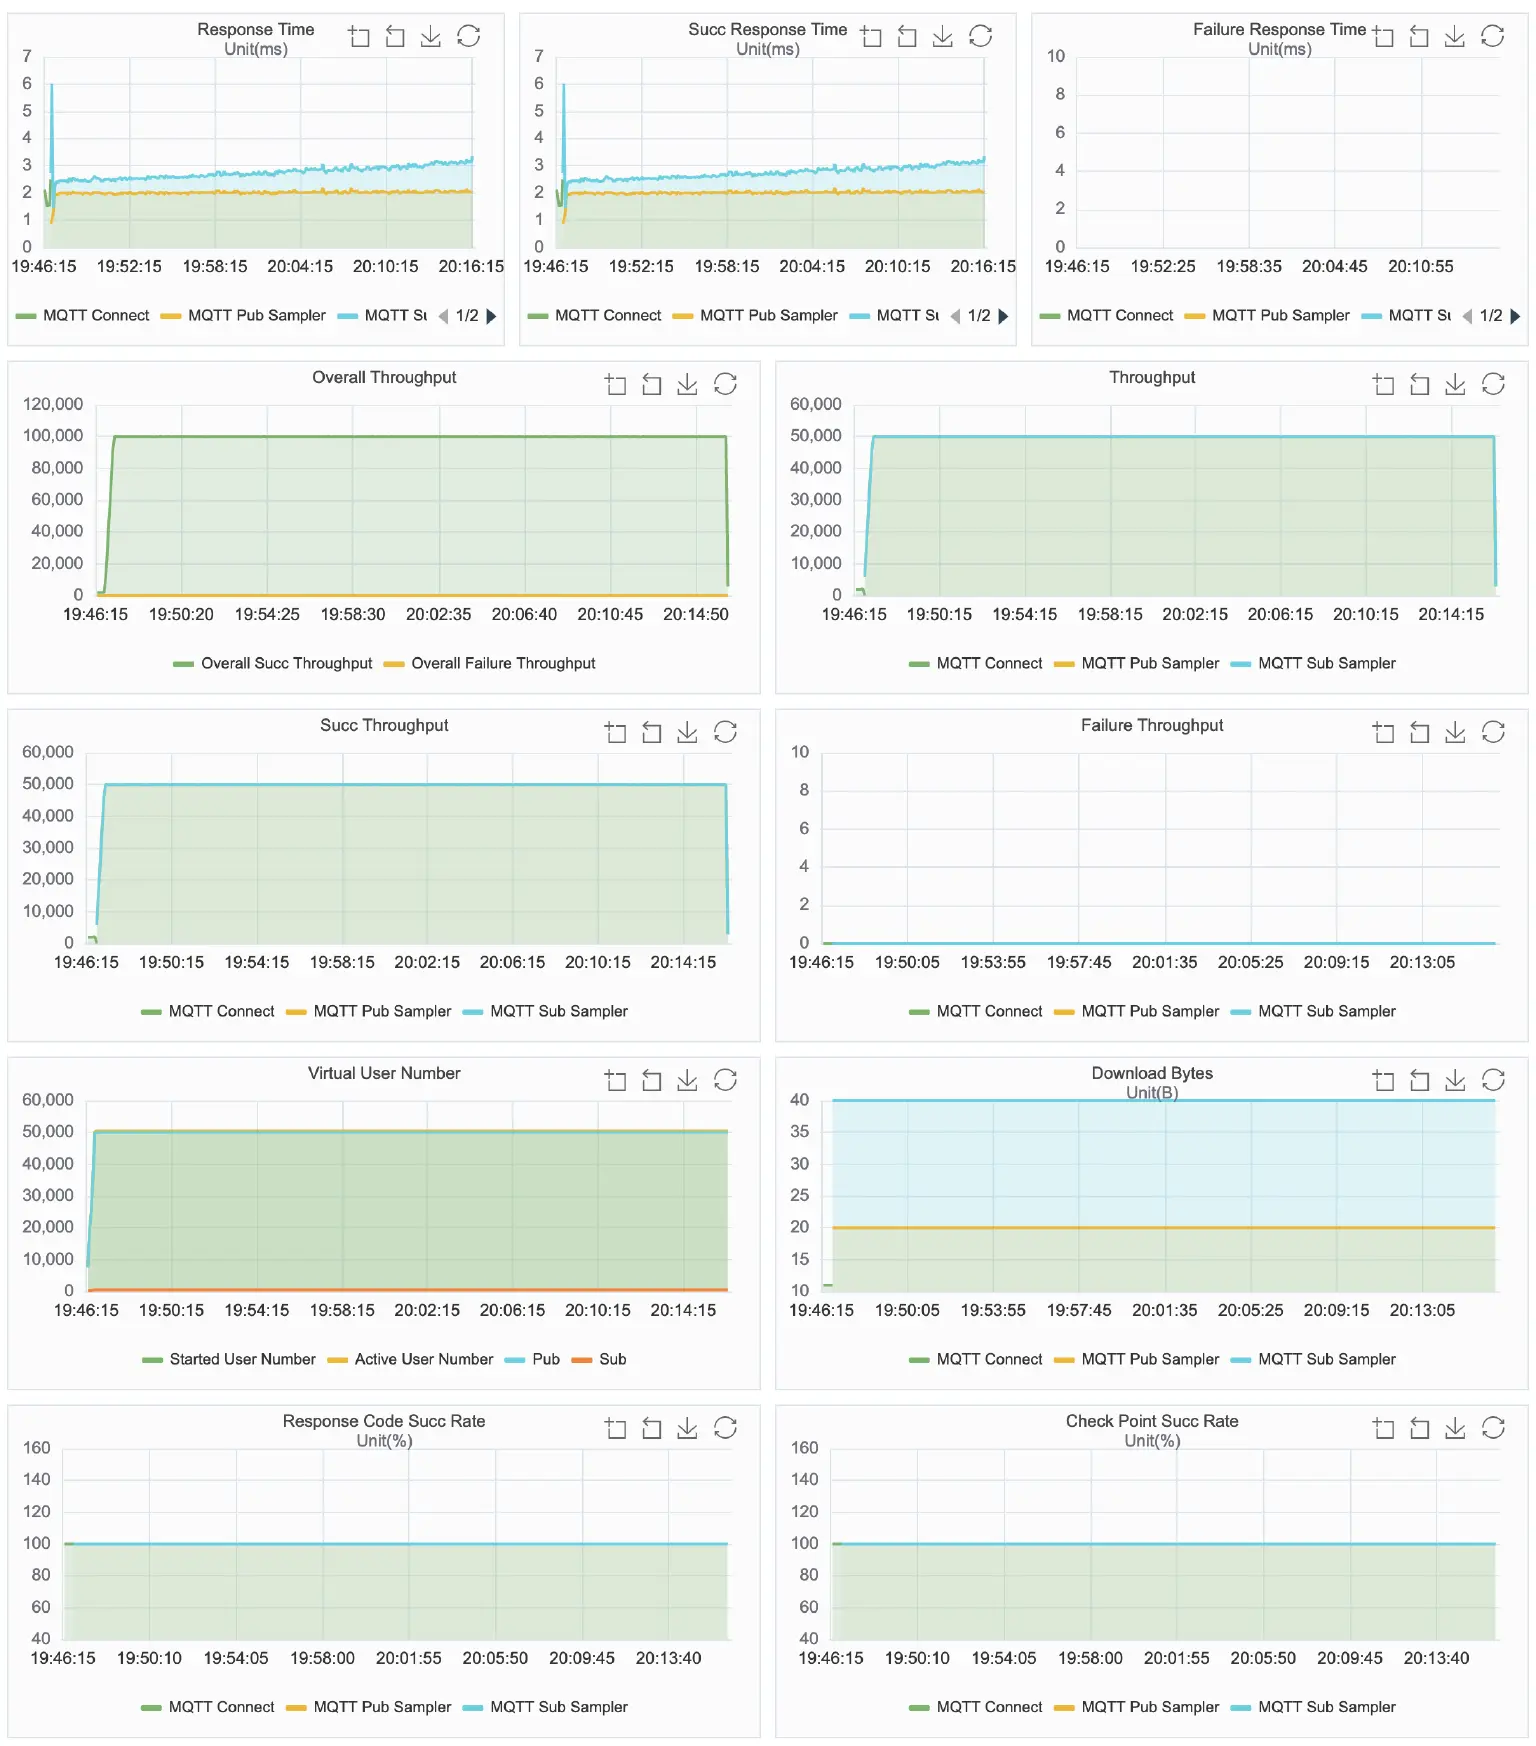
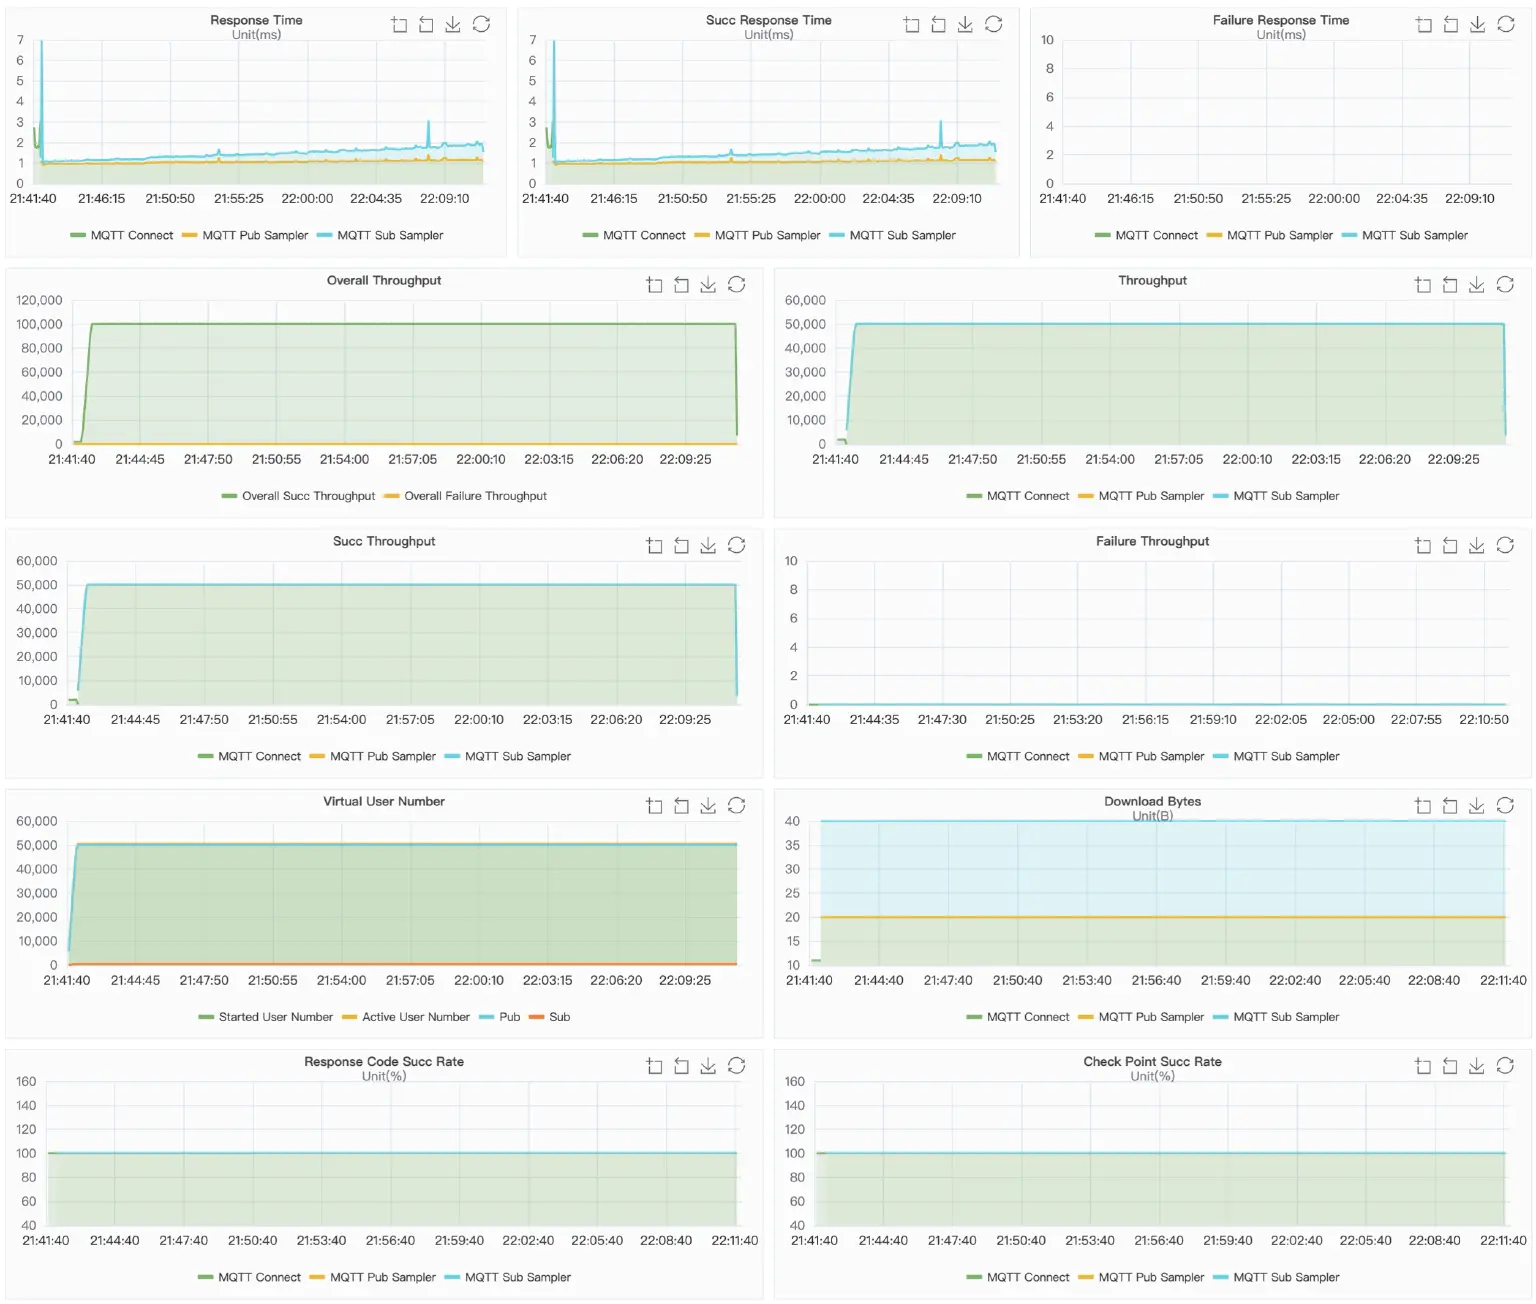
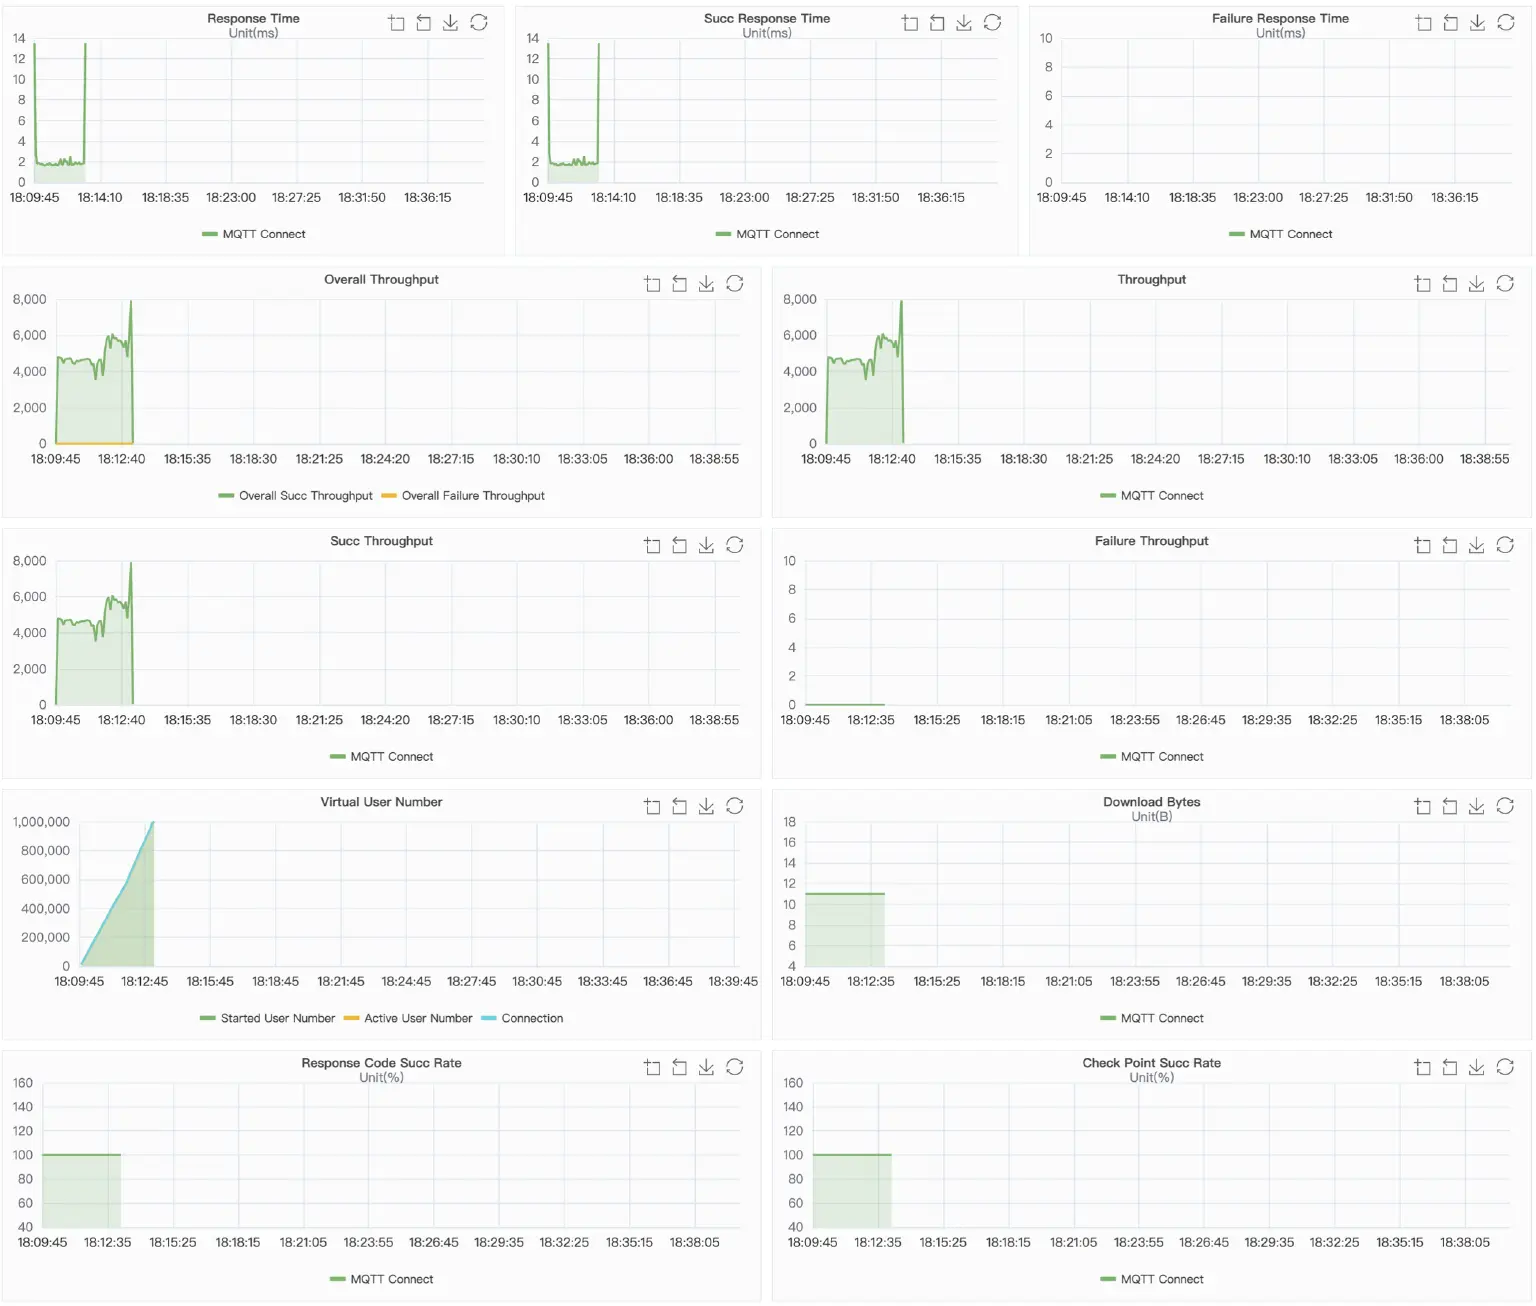
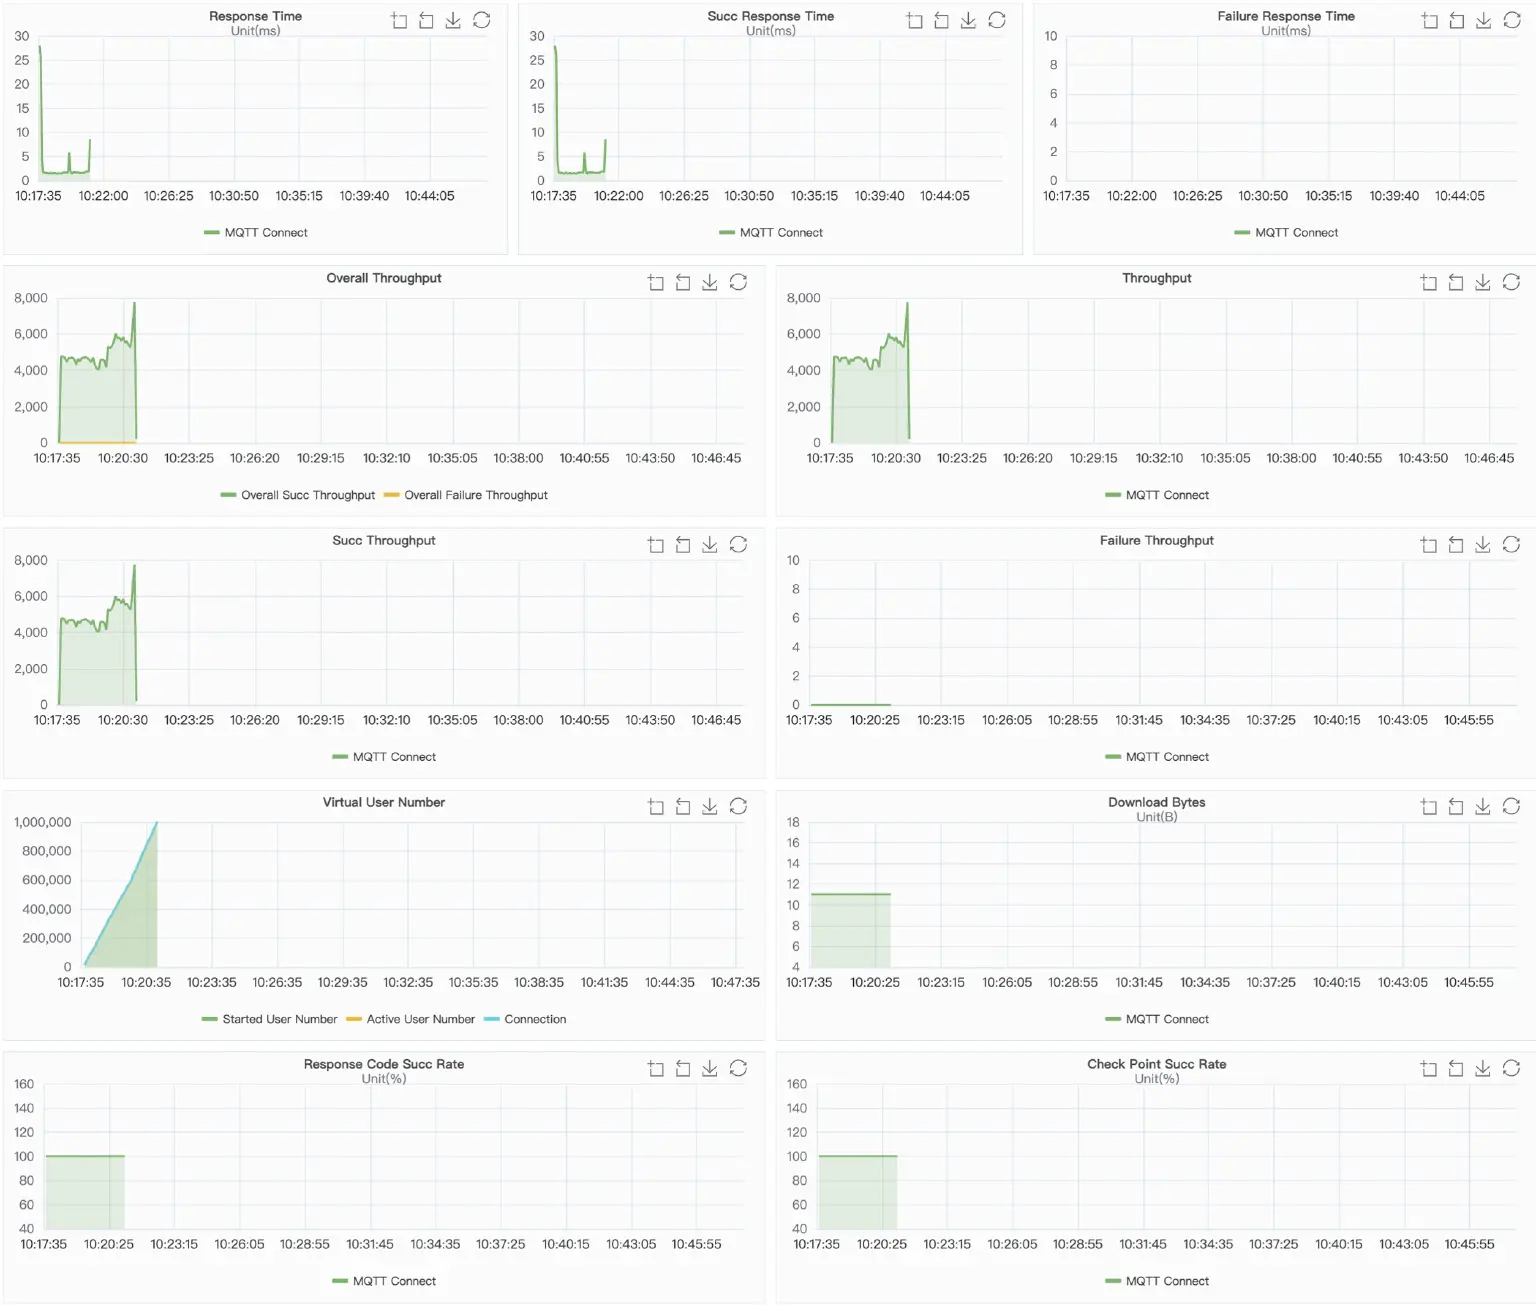
Concurrent connections: conn-tcp-1M-5K
Metrics
| Average latency (ms) | Max CPU user+system | Avg CPU user+system | Max memory used | Memory used Stable at | |
|---|---|---|---|---|---|
| EMQX | 2.4 | 35% | 22% | 10.77G | 8.68G |
| NanoMQ | 3.16 | 5% | 4% | 6.9G | 6.9G |
latency percentiles
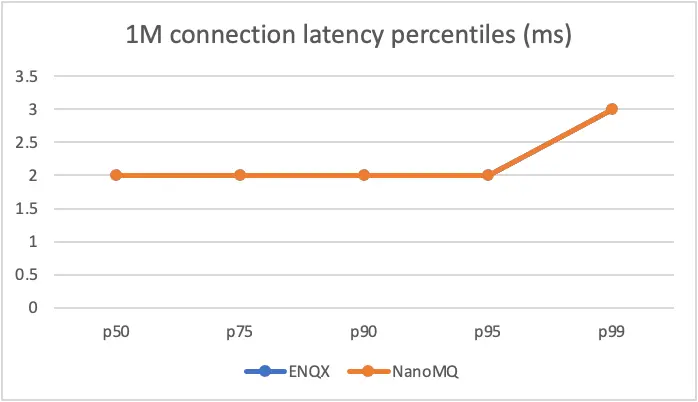
| Latency (ms) | EMQX | NanoMQ |
|---|---|---|
| p50 | 2 | 2 |
| p75 | 2 | 2 |
| p90 | 2 | 2 |
| p95 | 2 | 2 |
| p99 | 3 | 3 |
Result Charts
- EMQX
- NanoMQ
Conclusion
The benchmarking results above show that on a single node with the same configuration, EMQX has a smaller latency while NanoMQ uses less Memory and CPU . As mentioned in the blog post, due to the high scalability, reliability and rich features, EMQX is more suitable for deployment in the cloud, providing mission-critical MQTT services for large-scale applications in IoT. NanoMQ, with the nature of lightweight and efficient, is perfect for industrial IoT and IoT applications at the edge.