EMQX Cloud and IIoT: Industrial Data Ingestion and Insight from Edge to ClickHouse
Introduction
The Industrial Internet of Things (IIoT) is leading a digital revolution, redefining the ways in which data is collected, analyzed, and applied. Within this vast network, comprised of billions of devices, the real-time flow of data is crucial for achieving industrial automation, digitization, and efficient production. EMQX Cloud, serving as a cross-cloud fully managed MQTT cloud service platform, stands as a critical infrastructure software in this revolution. It facilitates seamless connectivity from the edge to the cloud, ensuring that data can be transmitted, processed, and analyzed in real-time.
This article will delve into how EMQX Cloud ingests data from edge computing with ClickHouse's data storage capabilities, providing essential data foundations for the Industrial Internet of Things.
EMQX Cloud: Addressing Challenges in IIoT
EMQX Cloud is a cloud-based MQTT broker service specifically designed to handle large-scale IIoT data streams. It offers reliable message delivery and device management functionalities to meet the requirements of the Industrial Internet of Things (IIoT) field. The core features of this platform include high-performance MQTT message brokering, device connection management, data routing, message storage, and real-time monitoring.
EMQX Cloud can empower IIoT advancement in the following aspects:
- Handling Large Data Volumes: In IIoT environments, devices generate massive amounts of data that require high-performance message delivery and data routing. EMQX Cloud efficiently handles large-scale data streams with its high-performance MQTT message broker and data routing capabilities, ensuring real-time data transmission and processing.
- Device Management: Managing connections, states, and firmware updates for a large number of devices is challenging. EMQX Cloud provides robust device connection management, allowing real-time monitoring of device online status and supporting over-the-air updates and remote management.
- Scalability and Reliability: As the number of devices increases, system scalability and reliability become critical. EMQX Cloud, with its cloud-based deployment and load-balancing technology, achieves highly scalable architecture, ensuring system availability and stability.
- Security Challenges: Data security in IIoT is paramount, as it may contain sensitive industrial information. EMQX Cloud offers robust data security protection by supporting TLS/SSL encryption and authentication, guaranteeing data confidentiality during transmission and storage.
Comprehensive Data Management: From NanoMQ to EMQX Cloud to ClickHouse
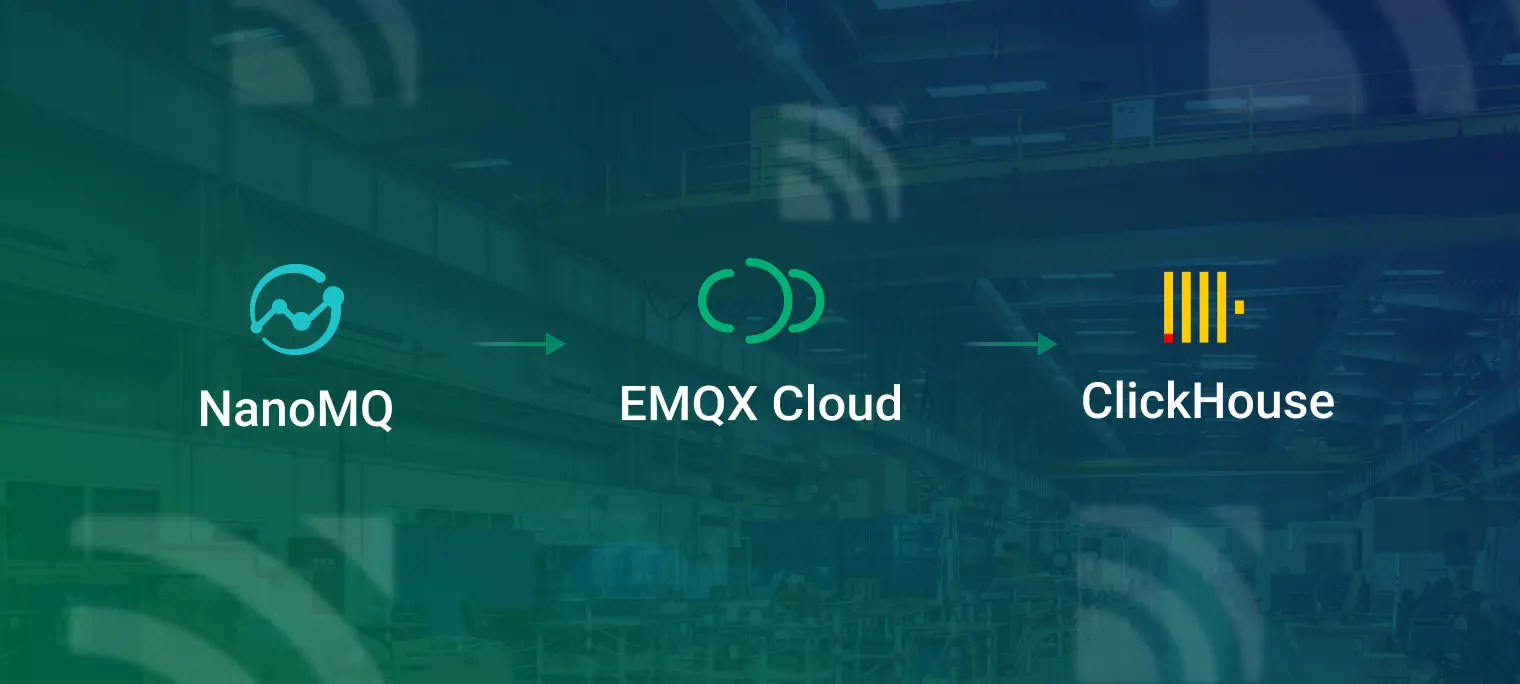
To build a seamless and efficient IoT data management solution for IIoT, we involve NanoMQ on a Raspberry Pi for communication with devices on edge, EMQX Cloud as a data hub to ensure the data transmission from edge to cloud, and ClickHouse for the data analysis. Organizations can gain in-depth insights from the collected and processed data, thus making informed decisions.
This article will demonstrate the following three main tasks:
- Install NanoMQ on Raspberry Pi
Firstly, we will guide you step by step on how to install and configure NanoMQ on the Raspberry Pi. This is the initial step in connecting devices to EMQX Cloud, ensuring everything is ready. - NanoMQ Data Bridging to EMQX Cloud
Task 2 involves efficiently bridging the NanoMQ on the Raspberry Pi with EMQX Cloud. We will provide detailed guidance to ensure the connection is properly set up. - EMQX Cloud Data Bridging to ClickHouse
Finally, we will discuss how to set up EMQX Cloud to bridge data to ClickHouse. This will help you achieve seamless data transfer for a complete data flow.
Deploying Edge Computing Solutions: Configuring NanoMQ
When deploying edge computing solutions, selecting the appropriate tools and components is crucial. NanoMQ stands out as a unique choice for an edge MQTT broker, offering distinct advantages.
Advantages of NanoMQ as an Edge MQTT Broker
- Lightweight and Resource-Friendly: NanoMQ is carefully crafted to operate on edge devices with limited resources, causing minimal impact on device performance.
- MQTT 5.0 Support: It supports the MQTT 5.0 protocol, providing additional features and better performance, enabling you to handle more complex communication requirements.
- Rapid Deployment: NanoMQ offers a streamlined deployment process, allowing you to quickly configure and launch the MQTT broker, reducing the complexity of deployment and configuration.
- Reliability and Stability: NanoMQ undergoes extensive testing and validation, demonstrating outstanding stability and reliability to ensure continuous operation in edge environments.
Install and Configure NanoMQ on Edge Devices
- Download NanoMQ
Visit the official EMQ website and download the EMQ NanoMQ version suitable for your edge device. - Install NanoMQ
Depending on the operating system of your device, execute the NanoMQ installation program. Typically, this involves extracting the downloaded files and running the installationscript. In this example, we will use the Apt repository to install NanoMQ on a Raspberry Pi.curl -s https://assets.emqx.com/scripts/install-nanomq-deb.sh | sudo bash sudo apt-get install nanomq - Configure NanoMQ
To configure NanoMQ bridging, you need to modify the configuration file /etc/NanoMQ_bridge.conf in the default path. In the configuration file, you can specify parameters for the MQTT broker, such as listening ports, authentication settings, and other options, to forward data received on specified topics to EMQX Cloud.
The configuration parameters are as follows:- Remote broker address
- MQTT protocol version
- Client identifier (default is automatically assigned by NanoMQ)
- Session clean
- Keep Alive
- Username
- Password
- Forwarded Topics (multiple topics separated by commas)
- QoS level
- Client concurrency
In this example, the configuration file is /etc/nanomq_bridge.conf.bridges.mqtt.name { ## TCP URL format: mqtt-tcp://host:port ## TLS URL format: tls+mqtt-tcp://host:port ## QUIC URL format: mqtt-quic://host:port server = "mqtt-tcp://x.x.x.x:1883" ## MQTT protocol version (4 | 5) proto_ver = 4 username = xxx password = xxx clean_start = true keepalive = 60s ## Uncomment the following code if bridging via TLS ## ssl { ## keyfile = "/etc/certs/key.pem" ## certfile = "/etc/certs/cert.pem" ## cacertfile = "/etc/certs/cacert.pem" ## } forwards = [ { remote_topic = "temp_hum/emqx" local_topic = "temp_hum/emqx" qos = 0 } ] max_parallel_processes = 2 max_send_queue_len = 1024 max_recv_queue_len = 1024 } - Start NanoMQ
Launch NanoMQ using the startup script or command. Once initiated, NanoMQ will begin listening on the specified port and be ready to accept MQTT connections.nanomq start --conf /etc/nanomq_bridge.conf
Verify the Installation and Functionality of NanoMQ
To verify the installation and functionality of NanoMQ, you can perform the following actions:
- Connect to NanoMQ
Use MQTT client tools such as MQTTX or mosquitto_sub/mosquitto_pub to connect to NanoMQ.
- Publish and Subscribe Messages
Publish a message and ensure that it can be successfully delivered to subscribers. This can validate the agent's message delivery functionality.
- Monitor and Logs
Check NanoMQ's log files to ensure there are no errors or exceptions. This helps ensure the broker is working correctly. - Performance Testing
You can use performance testing tools to simulate high-load conditions to ensure NanoMQ performs well on edge devices.
Once you have successfully verified the installation and functionality of NanoMQ, you can trust it as an MQTT broker in your edge computing solution to support your IoT communication needs.
Seamless Connection Between EMQX Cloud and Edge Devices
- Obtain SSL/TLS Certificates (Optional)
First, ensure that valid SSL/TLS certificates are obtained on EMQX Cloud. These certificates are used to encrypt communication to ensure the security of data transmission. - Configure Device Parameters and Establish Connection
On the edge device, using the configured parameters, the edge device attempts to connect to the EMQX Cloud server.
- Publish and Subscribe Testing
Use MQTTX to connect to EMQX Cloud, subscribe to the "temp_hum/emqx" topic, and check if you receive messages from NanoMQ.
In summary, establishing the connection between edge devices and EMQX Cloud requires thorough configuration. Testing the connection by publishing and subscribing to MQTT topics can help verify the feasibility of the connection. This process lays the foundation for seamless connectivity between EMQX Cloud and edge devices.
Integration with ClickHouse: Configuration, Data Transformation, and Persistence
Reasons for Choosing ClickHouse
Considering the advantages in terms of performance, scalability, flexibility, real-time processing, and cost-effectiveness, choosing ClickHouse as the time-series database contributes to ensuring the efficiency, reliability, and sustainability of the data integration process.
- High Performance and Fast Queries: ClickHouse is designed as a columnar storage database for large volumes of data, excelling in handling massive time-series data. Its unique storage structure and query engine enable fast execution in complex query scenarios, meeting the demand for rapid data analysis in industrial IoT environments.
- Horizontal Scalability: ClickHouse provides horizontal scalability, effectively handling continuously growing data streams. This allows the system to easily cope with the challenge of continuously increasing data volumes in industrial IoT scenarios, ensuring system stability and scalability.
- Flexible Data Model: ClickHouse's flexible data model allows storage and querying of various data types, accommodating different types of sensor and device data. This flexibility is crucial, especially in industrial IoT where data sources vary and may include numerical, textual, or even image data.
- Low-Latency Real-Time Processing: ClickHouse demonstrates low-latency characteristics in processing real-time data, which is crucial in industrial automation and monitoring systems. Low latency ensures that the entire process from data collection to storage and analysis happens as quickly as possible, enabling users to respond promptly.
- Cost-Effectiveness: ClickHouse is an open-source project, and its cost-effectiveness is a key advantage for large-scale data storage and analysis in industrial IoT. By choosing ClickHouse, it is possible to manage and analyze massive amounts of data more economically without sacrificing performance.
Create a ClickHouse Cloud Instance
- ClickHouse Cloud offers a 14-day free trial, allowing us to launch and run an instance within minutes.

- During this setup process, the ClickHouse instance was created on AWS in the northern region of Virginia (us-east-1), as the EMQX Cloud instance is also deployed in the same region.

- In the configuration process, it is important to pay attention to the connection settings. In this example, we use "Specific locations." Afterward, we need to add the NAT gateway IP address obtained from the EMQX Cloud deployment to the whitelist.

After the configuration is complete, you will only need a few seconds to see the service is up and running.
- Click on Connect ---> Connect to SQL console, and use the following SQL statements to create a database named "emqx." Then, create a table named "temp_hum" to store temperature and humidity data from EMQX Cloud.
create database emqx;
use emqx;

CREATE TABLE emqx.temp_hum
(
    timestamp DateTime,
    client_id String,
    topic String,
    temp Float32,
    hum Float32
)
ENGINE = MergeTree()
PARTITION BY toYYYYMM(timestamp)
ORDER BY (timestamp);
- After creating the database and table structures, navigate to the ClickHouse overview page. Click on Connect ---> View connection string. On this page, you can find the connection information for the ClickHouse instance, including the username, password, and connection string.

Integration of MQTT Data into ClickHouse
- Enable NAT Gateway
NAT Gateway provides the capability to access public network resources for the deployment of EMQX Cloud Professional Edition, without the need for VPC peer connections. Before connecting to ClickHouse, please enable the NAT Gateway.
After the service is running, add the IP address shown in the figure to the ClickHouse whitelist to facilitate access by the EMQX Cloud cluster.
- Create New Resource
Access the EMQX Cloud console, open the data integration page, and select the ClickHouse service.
Fill in the ClickHouse database information that was just created.- Server Address: ClickHouse service connection address + port.
- Database Name: The name of the ClickHouse database.
- ClickHouse User: The username used to connect to ClickHouse.
- ClickHouse Key: The password used to connect to ClickHouse.

- Create Rules
Under "Configured Resources," select ClickHouse resources. Click on "Create New Rule" and enter the following rules to match SQL statements. The SELECT part of the rule includes the following fields:- timestamp: Real-time timestamp of the reported message.
- Client ID: ID of the device sending the message.
- Payload: Payload of temp_hum/emqx topic messages, including temperature and humidity data.
SELECT
   (timestamp div 1000) as timestamp,
   clientid as client_id,
   topic as topic,
   payload.temp as temp,
   payload.hum as hum
FROM
"temp_hum/emqx"
Enable SQL testing, fill in the required fields, and click "SQL Test" to verify if the rules are effective. Under normal circumstances, you should obtain the expected results as shown in the screenshot.
- Add Action
Click the "Next" button at the bottom to create the action. Choose the previously created resources from the dropdown list. In the SQL template, enter the following data to insert them into the SQL template.insert into temp_hum (timestamp, client_id, topic, temp, hum) values (${timestamp}, '${client_id}', '${topic}', ${temp}, ${hum})
After confirming the information is correct, click the "Confirm" button in the bottom right corner to complete the configuration of the data integration. Through these steps, you can successfully configure ClickHouse integration, transforming MQTT data into a structure suitable for a time-series database, and verify the correct transmission and storage of data. This will enable you to easily analyze and query time-series data.
Test ClickHouse Integration
This section provides test steps to ensure the reliability of ClickHouse integration and the effectiveness of data persistence.
- After the edge device sends a message to Nanomq, check whether there is an increase in successful occurrences in the data integration rule monitoring of EMQX Cloud. If there are any anomalies, you can go to the deployment logs for further investigation.

- Go to the ClickHouse dashboard to check if the data has been successfully forwarded. The graphical representation displays time in UTC. If necessary, you can also export the data from this page.

In-Depth Data Analysis: Gaining Insights with ClickHouse
Once data has been successfully integrated into ClickHouse, the next step is to delve into data analysis using queries and visualization tools to gain insights into Industrial Internet of Things (IIoT) systems.
Characteristics of ClickHouse Query Language
ClickHouse is a columnar database management system designed for large-scale data analysis, and its query language has some unique features. Here are some characteristics of the ClickHouse query language:
- Columnar Storage and Queries: ClickHouse is a columnar database that stores data in columns rather than rows. This columnar storage structure excels in large-scale data analysis scenarios, especially for aggregation and filtering operations.
- Parallel Query Processing: ClickHouse can process multiple queries in parallel, enhancing query performance. This is achieved by partitioning data into multiple partitions and simultaneously processing queries on these partitions. This parallel processing capability allows ClickHouse to efficiently handle large-scale datasets.
- Support for Complex Data Types: ClickHouse supports various complex data types, including arrays, tuples, and maps. This flexibility enables it to handle different types of data effectively.
- High-Performance Aggregation Functions: ClickHouse provides a rich set of built-in aggregation functions for performing various statistical and aggregation operations. These optimized aggregation functions can quickly execute on large-scale datasets.
- Flexible Storage Engine Support: ClickHouse features a pluggable storage engine architecture, allowing users to choose different storage engines to meet specific requirements. Support for multiple storage engines enables ClickHouse to be applied flexibly in various scenarios.
- Distributed Query Support: ClickHouse has a distributed architecture, capable of running on multiple nodes and supporting distributed queries. This distributed query capability allows ClickHouse to handle large-scale datasets while maintaining low query latency.
- Real-time Data Insertion and Querying: ClickHouse is not only suitable for batch data processing but also supports fast insertion and querying of real-time data. This makes it suitable for scenarios that require timely analysis and querying of real-time data.
In summary, the characteristics of ClickHouse's query language include high-performance columnar storage and queries, parallel query processing, support for complex data types, rich aggregation functions, flexible storage engine support, and distributed query capabilities, making it a powerful tool for large-scale data analysis.
Create a real-time monitoring dashboard
To achieve real-time monitoring of ClickHouse, we can employ the following methods:
- Prometheus and Grafana
Integrating Prometheus and Grafana is a widely adopted approach for real-time monitoring of ClickHouse. We can configure Prometheus to collect various metrics from ClickHouse and create intuitive dashboards with Grafana to monitor performance, query speed, and more in real-time. - ClickHouse System Tables
ClickHouse provides a series of System tables that contain detailed information about the performance of the ClickHouse cluster. By querying these tables, we can obtain real-time performance and status information. Here are some example queries for retrieving ClickHouse performance metrics:-- Query ClickHouse node status SELECT * FROM system.clusters; -- Query performance of ClickHouse cluster queries SELECT * FROM system.query_log; -- Query size and disk usage of ClickHouse tables SELECT * FROM system.parts;
Please note that specific query steps may vary depending on the ClickHouse version and cloud service provider. It is recommended to refer to the official ClickHouse documentation for the latest information on using monitoring and dashboard features. - ClickHouse Client Tools
ClickHouse provides some command-line tools and web interfaces, such as clickhouse-client and clickhouse-web, which can be used to monitor the status of ClickHouse. These tools offer a comprehensive overview of real-time performance data and cluster status. - Monitoring Tools from Cloud Service Providers
In the ClickHouse Cloud control panel, we can utilize monitoring dashboards from cloud service providers to view resource usage related to ClickHouse for specific time periods. Ensure timely access to the latest documentation from your cloud service provider to better leverage its monitoring capabilities.
Data Accuracy and Real-time Validation
- Data Accuracy Validation
- Data Consistency Checks: Utilize ClickHouse's data consistency checking tools to ensure consistency among data across different nodes.
- Integrity Constraints: Employ appropriate constraints such as primary keys and unique keys in table structures to ensure data integrity.
- Data Replay and Comparison: Regularly replay data and compare the results with the source data to validate data accuracy.
- Real-time Validation
- Performance Monitoring: Use built-in performance monitoring tools in ClickHouse to monitor query performance, loads, and system resource utilization to ensure real-time performance.
- Real-time ETL Processes: If there are real-time data requirements, consider using streaming ETL tools to rapidly import real-time data into ClickHouse, ensuring timely data updates.
- Query Optimization: Optimize query statements and indexes for real-time queries to enhance query performance.
In summary, although ClickHouse itself is not a traditional real-time data processing engine and focuses on analytical workloads, if there is a high demand for real-time performance, consider combining it with other technologies. For example, integrating streaming processing engines (such as Apache Kafka Streams or Apache Flink) with ClickHouse can meet real-time requirements.
Conclusion
Industrial digitization requires a platform that can handle complex data streams, ensure security, and provide deep insights. EMQX Cloud not only meets these requirements but also drives innovation in industrial IoT by tightly integrating with MQTT and ClickHouse. This close integration ensures seamless connectivity of data flow from devices to databases, regardless of data volume or complexity. Through practical validation, EMQX Cloud has demonstrated outstanding high performance and reliability in various scenarios, making it an ideal choice for building and expanding industrial IoT solutions.